Zeenea is a proud sponsor of BARC’s Data Culture Survey 23. Get your free copy here.
In last year’s BARC Data Culture Survey 22, “data access” was selected as the most relevant aspect of BARC’s ‘Data Culture Framework’. Therefore, this year, BARC examined the current status, experiences, and plans of companies with regard to their efforts to create a positive data culture with a special emphasis on ‘data access’.
The study was based on the findings of a worldwide online survey conducted in July and August 2022. The survey was promoted within the BARC panel, as well as via websites and newsletter distribution lists. A total of 384 people took part, representing a variety of different roles, industries, and company sizes.
In this article, discover the current status of data-driven decision-making of BARC’s Data Culture Survey 23.
Data-driven decision making versus gut feeling
74% of “best-in-class”* companies rely on data-driven decision-making
Over the years, companies have relied on data & analytics for decision-making rather than purely on experience or gut feeling. However, while the share of companies making decisions solely based on experience is decreasing, it isn’t completely off the radar. In fact, according to the BARC Data Culture Survey 23, half of the companies surveyed said their decision-making process was based on a mixture of data and gut feeling. In particular, there was a massive shift towards data-driven decision-making in 2021, probably driven by external factors such as the COVID-19 crisis.
The value of data for decision-making thus remains clear to most organizations, especially in the current economic & political environment. The challenge was more related to being able to bring value to data at a reasonable cost.
It is noteworthy that 74% of “best-in-class”* companies completely rely on data to make decisions. If we look closely at the numbers below, this reveals a significant difference compared to the average of all participating companies, of which only 32% make decisions purely based on data.

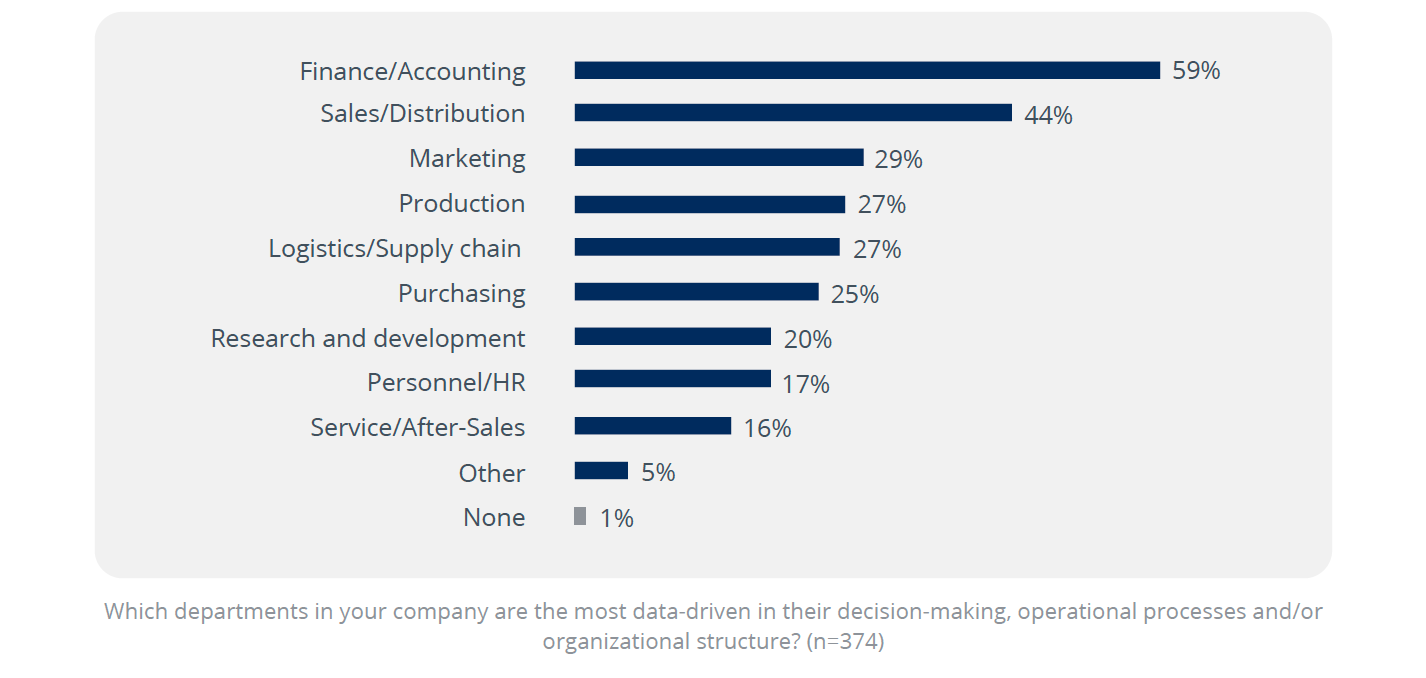
The most data-driven departments of a company
When asked about the departments they considered to be the most data-driven, 59% of companies responded that it was their finance/accounting department, followed by their sales & distribution department at 44%. These answers were expected, as these areas have the highest BI and analytics tools usage. BARC also observed that the Logistics/Supply Chain department as well as the Production department were a lot higher than expected. This increase is the result of the rise of IoT technologies in recent years.
Data-driven decision support should be at all levels of the company
Data knowledge is key to the successful use of data & analytics – 83% of companies confirm that they see data/information as an asset, but only half of the companies surveyed use data as a major source of revenue. Indeed, 74% of users identify data knowledge as the collecting, linking, and analyzing of metadata.
Metadata provides contextual information necessary to help data users find, understand, and trust their data. However, the study shows that few companies currently invest in technologies that help leverage metadata – whereas 95% of the “best-in-class”* companies acknowledge the importance of investing in such technologies.
The use of data at various levels of decision-making is noteworthy: At both operational and tactical levels in business units, 39% of survey respondents claim that decisions are not made on the basis of data. This is quite a high figure – data-driven decision support should be in place throughout the company at all levels.

Liberalize data access & empower your data users through a strong data culture
If you’re interested in learning more about the findings of BARC’s Data Culture survey 23 & the importance of democratizing data access, download the document for free!
By downloading the survey, get insights on:
- The assessment of the data access philosophies,
- The effects of the implementation of a data culture,
- The challenges of implementing data access,
- And much more.
* The sample was divided into ‘best-in-class’ and ‘laggards’ in order to identify differences in terms of the current data culture within organizations. This division was made based on the question “How would you rate your company’s data culture compared to your main competitors?”. Companies that have a much better data culture than their competitors are referred to as ‘best-in-class’, while those who have a slightly or much worse data culture than their competitors are classed as ‘laggards’.


