Zeenea for Retail
Ensure your retail data is properly analyzed and exploited with our data discovery platform. Try ZeeneaZeenea helps retailers get the most value out of their existing data assets. Leverage our data discovery platform to:
- Initiate a data-driven strategy
- Unlock value from your ever-growing data that is generated by expanding your digital services
- Deliver outstanding shopping experiences with insightful data
- Improve your demand-based pricing strategy with Big Data
- Strike the right balance between defensive and offensive data governance.
Zeenea use cases in the retail industry
![]()
Personalized shopping experiences
![]()
Conversation rate improvement
![]()
Increase customer trust
![]()
Pricing Optimization
![]()
Supply chain connectivity
How Zeenea Unlocks Data for the Retail Industry
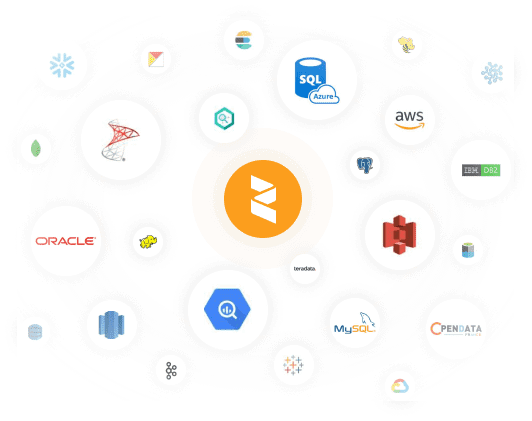
Our universal connectivity and API-first approach allows Zeenea to adapt to any system, and to any data strategy (edge, cloud, multi-cloud, cross-cloud, hybrid) to build an enterprise-wide information repository.
We provide the most comprehensive connectivity of the market with the ability to automate metadata curation with our wide range of connectors.

Our platform provides modular metamodel templates that enable banks and insurance companies to quickly and incrementally build easy-to-use and comprehensive models to serve business needs and regulatory reports.
Structure your assets’ documentation with simple “drag & drop” features and create documentation templates for each type of asset in the way that works best for you.
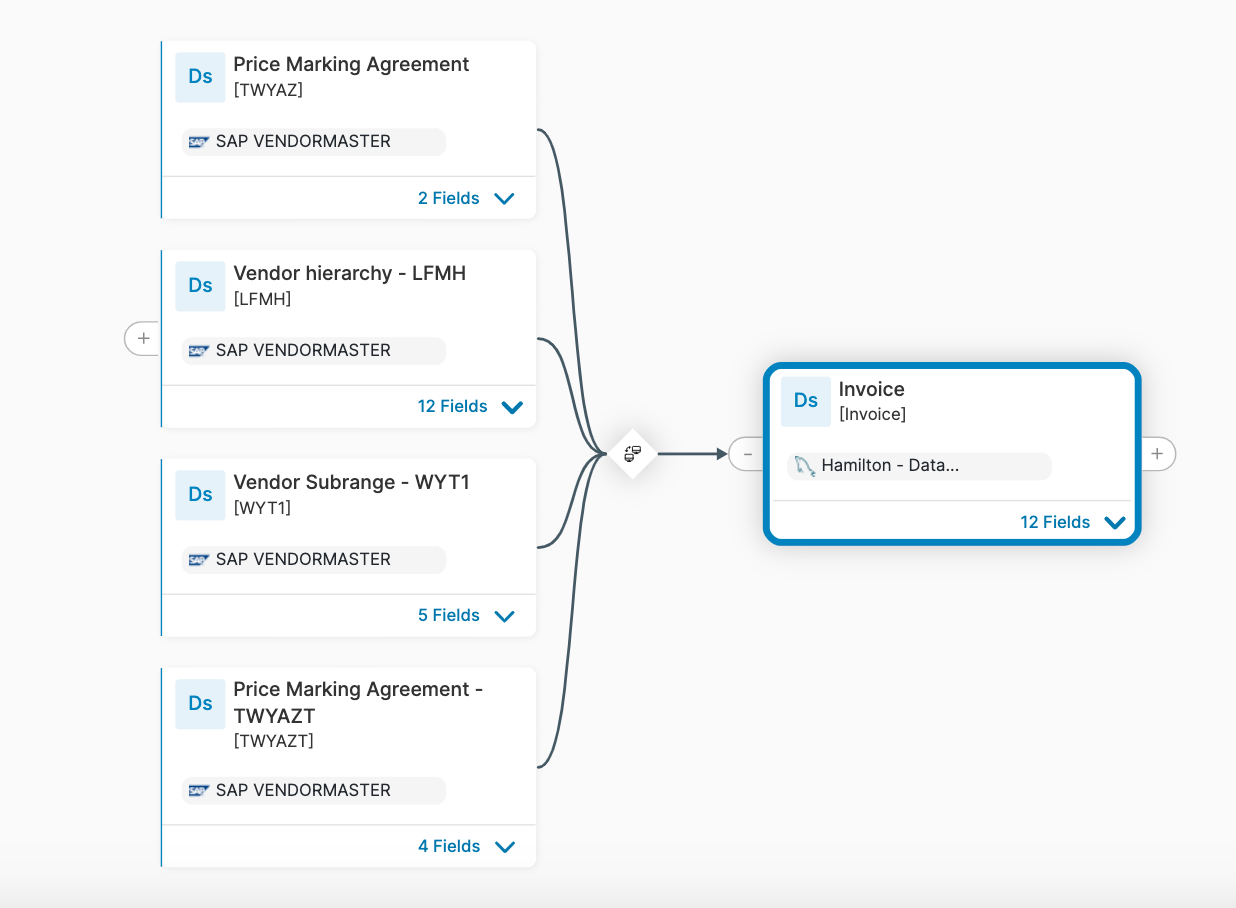
Zeenea automates data lineage by gathering data processes and data asset transformations from ETL platforms and data pipelines, or from manual descriptions for compliance and regulation.
Our solution also provides an audit trail for any action done in the data catalog.
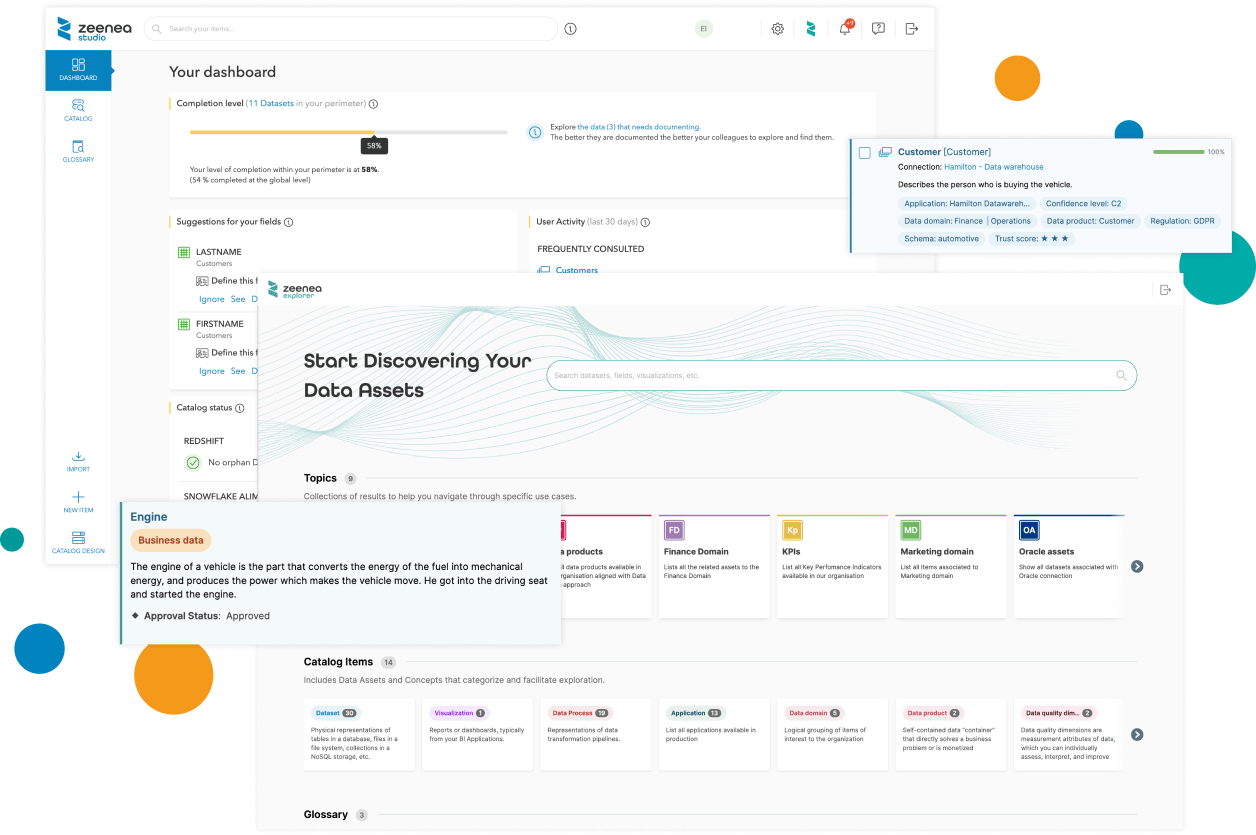
Both of our applications provide all your data consumers with sharing capabilities to allocate their knowledge on various objects in the catalog through collaborative features.
Thus, interactions between teams and experts will be simplified and the aggregation of knowledge acquired during use cases will finally be possible.
UNLOCK DATA FOR THE RETAIL INDUSTRY
Check out our other resources
