Logo Zeenea 2020
Actian Logo Rgb Horizontal
  • Product
        • TECHNOLOGY

        • Data Discovery Platform
        • Connectivity
        • Knowledge Graph
        • SOLUTIONS

        • Data Catalog
        • Enterprise Data Marketplace
        • CAPABILITIES

        • Business Glossary
        • Data Compliance
        • Data Discovery
        • Data Governance
        • Data Lineage
        • Data Quality
        • Data Shopping
        • Data Stewardship
        • Metadata Management
        • APPLICATIONS

        • Zeenea Studio
        • Zeenea Explorer
        • Unlock the Live Product Tour
  • Use Cases
        • INDUSTRIES

        • Financial Services
        • Manufacturing
        • Retail
        • Pharmaceuticals
        • DATA LEADERS

        • Data Managers
        • Data Producers
        • Data Consumers
        • The Practical Guide To Data Mesh Banner En
  • Resources
        • KNOWLEDGE HUB

        • Data Library
        • Customer Stories
        • Podcast
        • Blog
        • PRODUCT HUB

        • Product Updates
        • Zeenea Explained
        • The Data Democracy Podcast
  • Company
        • ABOUT

        • Our Story
        • Trust Center
        • GET IN TOUCH

        • Contact
        • Partner Network
        • SERVICES

        • Professional Services
        • Support
        • BELIEFS

        • Data Democracy
        • Data Mesh
        • What is a Data Democracy
  • Try Zeenea
  • Get a demo
  • English
    • Deutsch
    • Français
HCLSoftware Completes Acquisition of Metadata Management Software Provider Zeenea

HCLSoftware Completes Acquisition of Metadata Management Software Provider Zeenea

by Anthony Corbeaux | Sep 12, 2024 | News & events

Acquisition will enable Actian, a division of HCLSoftware, to offer customers a complete data ecosystem.

SANTA CLARA, Calif., September 12, 2024 – HCLSoftware, the software business division of HCLTech, today announced that it completed the acquisition of Zeenea, an innovator in data catalog and governance solutions based in Paris, France. The acquisition of Zeenea enables Actian, a division of HCLSoftware, to offer a unified data intelligence and governance solution that empowers customers to seamlessly discover, govern, and maximize the value of their data assets. It also further extends Actian’s presence, workforce, and customer base in Europe.

“To become data-driven, organizations of all sizes need data governance to ensure the most effective and efficient use of quality data throughout its life cycle,” said Marc Potter, CEO at Actian. “With Zeenea as part of our portfolio, Actian offers customers a complete data ecosystem – making Actian a one-stop shop for all things data. Together, we will help our customers propel their GenAI and analytics initiatives forward by boosting confidence in data preparation and enhancing data readiness.”

According to ISG Research, 85% of enterprises believe that investment in generative AI technology in the next 24 months is critical. Data governance and data quality work in tandem to ensure the data feeding the GenAI solutions is accurate, complete, fit-for-purpose, and used according to governance policies.

Zeenea is recognized for its cloud-native Data Discovery Platform with universal connectivity that supports metadata management applications from search and exploration to data catalog, lineage, governance, compliance and enterprise data marketplace. Powered by an adaptive knowledge graph, Zeenea enables organizations to democratize data access and generate a 360-degree view of their assets, including the relationships between them.

About Actian

Actian  makes data easy. We deliver a complete data solution that simplifies how people connect, manage, govern and analyze data. We transform business by enabling customers to make confident, intelligent, data-driven decisions that accelerate their organization’s growth. Our data platform integrates seamlessly, performs reliably, and delivers industry-leading speeds at an affordable cost. Actian is a division of HCLSoftware.

About HCLSoftware

HCLSoftware is the software business division of HCLTech, serving more than 7,000 organizations in 130 countries in five key areas: Data and Analytics; Business and Industry Applications (including Commerce, MarTech Automation); Intelligent Operations; Total Experience; and Cybersecurity.

https://www.hcl-software.com/

For further details, please contact:

Danielle Lee, ActianDanielle.Lee@actian.com

Jeremy McNeive, HCLSoftware jeremy.mcneive@hcl.com

Harnessing the Power of AI in Data Cataloging

Harnessing the Power of AI in Data Cataloging

by Zeenea Software | Jul 8, 2024 | Data Catalog

In today’s era of expansive data volumes, AI stands at the forefront of revolutionizing how organizations manage and extract value from diverse data sources. Effective data management becomes paramount as businesses grapple with the challenge of navigating vast amounts of information. At the heart of these strategies lies data cataloging—an essential tool that has evolved significantly with the integration of AI, with promises of efficiency, accuracy, and actionable insights. Let’s see how in this article.

The benefits of AI in data cataloging


AI revolutionizes data cataloging by automating and enhancing traditionally manual processes, thereby accelerating efficiency and improving data accuracy across various functions:

Automated metadata generation


AI algorithms autonomously generate metadata by analyzing and interpreting data assets. This includes identifying data types, relationships, and usage patterns. Machine learning models infer implicit metadata, ensuring comprehensive catalog coverage. Automated metadata generation reduces the burden on data stewards and ensures consistency and completeness in catalog entries. This capability is precious in environments with rapidly expanding data volumes where manual metadata creation could be more practical.

Simplified data classification and tagging


AI facilitates precise data classification and tagging using natural language processing (NLP) techniques. By understanding contextual nuances and semantics, AI enhances categorization accuracy, which is particularly beneficial for unstructured data formats such as text and multimedia. Advanced AI models can learn from historical tagging decisions and user feedback to improve classification accuracy. This capability simplifies data discovery processes and enhances data governance by consistently and correctly categorizing data.

Enhanced Search capabilities


AI-powered data catalogs feature advanced search capabilities that enable swift and targeted data retrieval. AI recommends relevant data assets and related information by understanding user queries and intent. Through techniques such as relevance scoring and query understanding, AI ensures that users can quickly locate the most pertinent data for their needs, thereby accelerating insight generation and reducing time spent on data discovery tasks.

Robust Data lineage and governance


AI is crucial in tracking data lineage by tracing its origins, transformations, and usage history. This capability ensures robust data governance and compliance with regulatory standards. Real-time lineage updates provide a transparent view of data provenance, enabling organizations to maintain data integrity and traceability throughout its lifecycle. AI-driven lineage tracking is essential in environments where data flows through complex pipelines and undergoes multiple transformations, ensuring all data usage is documented and auditable.

Intelligent Recommendations


AI-driven recommendations empower users by suggesting optimal data sources for analyses and identifying potential data quality issues. These insights derive from historical data usage patterns. Machine learning algorithms analyze past user behaviors and data access patterns to recommend datasets that are likely to be relevant or valuable for specific analytical tasks. By proactively guiding users toward high-quality data and minimizing the risk of using outdated or inaccurate information, AI enhances the overall effectiveness of data-driven operations.

Anomaly Detection


AI-powered continuous monitoring detects anomalies indicative of data quality issues or security threats. Early anomaly detection facilitates timely corrective actions, safeguarding data integrity and reliability. AI-powered anomaly detection algorithms utilize statistical analysis and machine learning techniques to identify deviations from expected data patterns.

This capability is critical in detecting data breaches, erroneous data entries, or system failures that could compromise data quality or pose security risks. By alerting data stewards to potential issues in real-time, AI enables proactive management of data anomalies, thereby mitigating risks and ensuring data consistency and reliability.

The challenges and considerations of AI in data cataloging


Despite its advantages, AI-enhanced data cataloging presents challenges requiring careful consideration and mitigation strategies.

Data Privacy and Security


Protecting sensitive information requires robust security measures and compliance with data protection regulations such as GDPR. AI systems must ensure data anonymization, encryption, and access control to safeguard against unauthorized access or data breaches.

Scalability


Implementing AI at scale demands substantial computational resources and scalable infrastructure capable of handling large volumes of data. Organizations must invest in robust IT frameworks and cloud-based solutions to support AI-driven data cataloging initiatives effectively.

Data Integration


Harmonizing data from disparate sources into a cohesive catalog remains complex, necessitating robust integration frameworks and data governance practices. AI can facilitate data integration by automating data mapping and transformation processes. However, organizations must ensure compatibility and consistency across heterogeneous data sources.


In conclusion, AI’s integration into data cataloging represents a transformative leap in data management, significantly enhancing efficiency and accuracy. AI automates critical processes and provides intelligent insights to empower organizations to exploit their data assets fully in their data catalog. Furthermore, overcoming data privacy and security challenges is essential for successfully integrating AI. As AI technology advances, its role in data cataloging will increasingly drive innovation and strategic decision-making across industries.

[SERIES] Data Shopping Part 2 – The Zeenea Data Shopping Experience

[SERIES] Data Shopping Part 2 – The Zeenea Data Shopping Experience

by Zeenea Software | Jun 24, 2024 | Data Catalog, Data Mesh

Just as shopping for goods online involves selecting items, adding them to a cart, and choosing delivery and payment options, the process of acquiring data within organizations has evolved in a similar manner. In the age of data products and data mesh, internal data marketplaces enable business users to search for, discover, and access data for their use cases.

In this series of articles, get an excerpt from our Practical Guide to Data Mesh and discover all there is to know about data shopping as well as Zeenea’s Data Shopping experience in its Enterprise Data Marketplace:

  1. How to shop for data products
  2. The Zeenea Data Shopping experience


—–


In our previous article, we discussed the concept of data shopping within an internal data marketplace, addressing elements such as data product delivery and access management. In this article, we will explore the reason behind Zeenea’s decision to extend its data shopping experience beyond internal boundaries, as well as how our interface, Zeenea Studio, enables the analysis of the overall performance of your data products.

Data Product Shopping in Zeenea


In our previous article, we discussed the complexities of access rights management for data products due to the inherent risks of data consumption. In a decentralized data mesh, the data product owner assesses risks, grants access, and enforces policies based on the data’s sensitivity, the requester’s role, location, and purpose. This may involve data transformation or additional formalities, with delivery ranging from read-only access to fine-grained controls.

In a data marketplace, consumers trigger a workflow by submitting access requests, which data owners evaluate and determine access rules for, sometimes with expert input. For Zeenea’s marketplace we have chosen not to integrate this workflow directly into the solution but rather to interface with external solutions.

The idea is to offer a uniform experience for triggering an access request but to accept that the processing of this request may be very different from one environment to another, or even from one domain to another within the same organization – This principle is inherited from classical marketplaces. Most marketplaces offer a unique experience for making a purchase but connect to other systems for the operational implementation of delivery – the modalities of which can vary widely depending on the product and the seller.

This decoupling between the shopping experience and the operational implementation of delivery seems essential to us for several reasons.

The main reason is the extreme variability of the processes involved. Some organizations already have operational workflows, relying on a larger solution (data access requests are integrated into a general access request process, supported, for example, by a ticketing tool such as ServiceNow or Jira). Others have dedicated solutions supporting a high level of automation but whose deployment is not yet widespread. Still, others rely on the capabilities of their data platform, and some even on nothing at all – access is obtained through direct requests to the data owner, who handles them without a formal process. This variability is evident from one organization to another but also within the same organization – structurally, when different domains use different technologies, or temporally when the organization decides to invest in a more efficient or secure system and must gradually migrate access management to this new system.

Decoupling, therefore, allows offering a consistent experience to the consumer while adapting to the variability of operational methods.

For a data marketplace customer, the shopping experience is very simple. Once the data product(s) of interest is identified, they trigger an access request by providing the following information:

  1. Who they are – this information is already available.
  2. Which data product they want to access – this information is also already available, along with the metadata needed for decision-making.
  3. What they intend to use the data for – this is crucial since it drives risk management and compliance requirements.

With Zeenea, once the access request is submitted, it is processed in another system, and its status can be tracked from the marketplace – this is the direct equivalent of order tracking found on e-commerce sites.

From the consumer’s perspective, the data marketplace provides a catalog of data products (and other digital products) and a simple, universal system for gaining access to these products.

For the producer, the marketplace plays a fundamental role in managing their product portfolio.

Enhance Data Product performance with Zeenea Studio


As mentioned earlier, in addition to the e-commerce system, which is intended for consumers, a classical marketplace also offers tools dedicated to sellers, allowing them to supervise their products, respond to buyer inquiries, and monitor the economic performance of their offerings. And other tools, intended for marketplace managers, to analyze the overall performance of products and sellers.

Zeenea’s Enterprise Data Marketplace integrates these capabilities into a dedicated back-office tool, Zeenea Studio. It allows for managing the production, consolidation, and organization of metadata in a private catalog and deciding which objects will be placed in the marketplace – which is a searchable space accessible to the widest audience.

These activities primarily fall under the production process – metadata are produced and organized together with the data products. However, it also allows for monitoring the use of each data product, notably by providing a list of all its consumers and the uses associated with them.

This consumer tracking helps establish the two pillars of data mesh governance:

  • Compliance and risk management – by conducting regular reviews, certifications, and impact analyses during data product changes.
  • Performance management – the number of consumers, as well as the nature of the uses made of them, are the main indicators of a data product’s value. Indeed, a data product that is not consumed has no value.

As a support tool for domains to control the compliance of their products and their performance, Zeenea’s Enterprise Data Marketplace also offers comprehensive analysis capabilities of the mesh – the lineage of data products, scoring, and evaluation of their performance, control of overall compliance and risks, regulatory reporting elements, etc.

This is the magic of the federated graph, which allows for exploiting information at all scales and provides a comprehensive representation of the entire data landscape.

The Practical Guide to Data Mesh: Setting up and Supervising an enterprise-wide Data Mesh


Written by Guillaume Bodet, co-founder & CPTO at Zeenea, our guide was designed to arm you with practical strategies for implementing data mesh in your organization, helping you:

✅ Start your data mesh journey with a focused pilot project
✅ Discover efficient methods for scaling up your data mesh
✅ Acknowledge the pivotal role an internal marketplace plays in facilitating the effective consumption of data products
✅ Learn how Zeenea emerges as a robust supervision system, orchestrating an enterprise-wide data mesh

Get the ebook
Signature Data Mesh En
Zeenea Product Recap: A look back at 2023

Zeenea Product Recap: A look back at 2023

by Zeenea Software | Jan 8, 2024 | Data Catalog, Zeenea Product

2023 was another big year for Zeenea. With more than 50 releases and updates to our platform, these past 12 months were filled with lots of new and improved ways to unlock the value of your enterprise data assets. Indeed, our teams consistently work on features that simplify and enhance the daily lives of your data and business teams.

In this article, we’re thrilled to share with you some of our favorite features from 2023 that enabled our customers to:

  • Decrease data search and discovery time
  • Increase Data Steward productivity & efficiency
  • Deliver trusted, secure, and compliant information across the organization
  • Enable end-to-end connectivity with all their data sources

Decrease data search and discovery time


One of Zeenea’s core values is simplicity. We strongly believe that data discovery should be quick and easy to accelerate data-driven initiatives across the entire organization.

In fact, many data teams still struggle to find the information they need for a report or use case. Either because they couldn’t locate the data because it was scattered in various sources, files, or spreadsheets, or maybe they were confronted with an overwhelming amount of information they didn’t even know how to begin their search.

In 2023, we designed our platform with simplicity. By providing easy and quick ways to explore data, Zeenea enabled our customers to find, discover, and understand their assets in seconds.

A fresh new look for the Zeenea Explorer


One of the first ways our teams wanted to enhance the discovery experience of our customers was by providing a more user-friendly design to our data exploration application, Zeenea Explorer. This redesign included:

New Homepage


Our homepage needed a brand-new look and feel for a smoother discovery experience. Indeed, for users who don’t know what they are looking for, we added brand-new exploration paths directly accessible via the Zeenea Explorer homepage.


  • Browsing by Item Type: If the user is sure of the type of data asset they are looking for, such as a dataset, visualization, data process, or custom asset, they directly access the catalog with it pre-filtered with the needed type of asset.
  • Browsing through the Business Glossary: Users can quickly navigate through the enterprise’s Business Glossary by directly accessing the Glossary assets that were defined or imported by stewards in Zeenea Studio.
  • Browsing by Topic: The app enables users to browse through a list of Items that represent a specific theme, use case, or anything else that is relevant to business (more information below).
New Zeenea Explorer Homepage 2023

New Item Detail Pages


To understand a catalog Item at a glance, one of the first notable changes was the position of the Item’s tabs. The tabs were originally positioned on the left-hand side of the page, which took up a lot of space. Now, the tabs are at the top of the page, more closely reflecting the layout of the Studio app. This new layout allows data consumers to find the most significant information about an Item such as:

  • The highlighted properties, defined by the Data Steward in the Catalog Design,
  • Associated Glossary terms, to understand the context of the Item,
  • Key people, to quickly reach the contacts that are linked to the Item.

In addition, our new layout allows users to find all fields, metadata, and all other related items instantly. Divided into three separate tabs in the old version, data consumers now find the Item’s description and all related Items in a single “Details” tab. Indeed, depending on the Item Type you are browsing through, all fields, inputs & outputs, parent/children Glossary Items, implementations, and other metadata are in the same section, saving you precious data discovery time.

Lastly, the spaces for our graphical components were made larger – users now have more room to see their Item’s lineage, data model, etc.

New Item Detail Page Zeenea Explorer

New Filtering system


Zeenea Explorer offers a smart filtering system to contextualize search results. Zeenea’s preconfigured filters can be used such as by item type, connection, contact, or by the organization’s own custom filters. For even more efficient searches, we redesigned our search results page and filtering system:


  • Available filters are always visible, making it easier to narrow down the search,
  • By clicking on a search result, an overview panel with more information is always available without losing the context of the search,
  • The filters most relevant to the search are placed at the top of the page, allowing to quickly get the results needed for specific use cases.
New Filtering System Explorer

Easily browsing the catalog by Topic


One major 2023 release was our Topics feature. Indeed, to enable business users to (even more!) quickly find their data assets for their use cases, Data Stewards can easily define Topics in Zeenea Studio. To do so, they simply select the filters in the Catalog that represent a specific theme, use case, or anything else that is relevant to business.

Data teams using Zeenea Explorer can therefore easily and quickly search through the catalog by Topic to reduce their time searching for the information they need. Topics can be directly accessed via the Explorer homepage and the search bar when browsing the catalog.

Browse By Topic Explorer New

Alternative names for Glossary Items for better discovery


In order for users to easily find the data and business terms they need for their use cases, Data Stewards can add synonyms, acronyms, and abbreviations for Glossary Items!

Ex: Customer Relationship Management > CRM

Alternative Names Zeenea Studio

Improved search performance


Throughout the year, we implemented a significant amount of improvements to enhance the efficiency of the search process. The addition of stop words, encompassing pronouns, articles, and prepositions, ensures a more refined and pertinent outcome for queries. Moreover, we added an “INFIELD:” operator, enabling users the capability to search for Datasets that contain a specific field.

Search In Fields Explorer

Microsoft Teams integration


Zeenea also strengthened our communication and collaboration capacities. Specifically, when a contact is linked to a Microsoft email address, Zeenea now facilitates the initiation of direct conversations via Teams. This integration allows Teams users to promptly engage with relevant individuals for additional information on specific Items. Other integrations with various tools are in the works. ⭐️

Microsoft Teams Zeenea Explorer

Increase Data Steward productivity & efficiency


Our goal at Zeenea is to simplify the lives of data producers so they can efficiently manage, maintain, and enrich the documentation of their enterprise data assets in just a few clicks. Here are some features and enhancements that help to stay organized, focused, and productive.

Automated Datasets Import


When importing new Datasets in the Catalog, administrators can turn on our Automatic Import feature which automatically imports new Items after each scheduled inventory. This time-saving enhancement increases operational efficiency, allowing Data Stewards to focus on more strategic tasks rather than the routine import process.

Auto Import Zeenea Studio 2

Orphan Fields Deletion


We’ve also added the to manage Orphan Fields more effectively. This includes the option to perform bulk deletions of Orphan Fields, accelerating the process of decluttering and organizing the catalog. Alternatively, Stewards can delete a single Orphan Field directly from its detailed page, providing a more granular and precise approach to catalog maintenance.

Orphan Field Details

Building reports based on the content of the catalog


We added a new section in Zeenea Studio – The Analytics Dashboard – to easily create and build reports based on the content and usage of the organization’s catalog.

Directly on the Analytics Dashboard page, Stewards can view the completion level of their Item Types, including Custom Items. Each Item Type element is clickable to quickly view the Catalog section filtered by the selected Item Type.

For more detailed information on the completion level of a particular Item Type, Stewards can create their own analyses! They select the Item Type and a Property, and they’re able to consult, and for each value of this property, the completion level of all your Item’s template, including its description, and linked Glossary Items.

New Analytics Dashboard Gif Without Adoption

New look for the Steward Dashboard


Zeenea Explorer isn’t the only application that got a makeover! Indeed, to help Data Stewards stay organized, focused, and productive, we redesigned the Dashboard layout to be more intuitive to get work done faster. This includes:


  • New Perimeter design: A brand new level of personalization when logging in to the Dashboard. The perimeter now extends beyond Dataset completion – it includes all the Items that one is a Curator for, including Fields, Data Processes, Glossary Items, and Custom Items.
  • Watchlists Widget: Just as Data Stewards create Topics for enhanced organization for Explorer users, they can now create Watchlists to facilitate access to Items requiring specific actions. By filtering the catalog with the criteria of their choice, Data Stewards save these preferences as new Watchlists via the “Save filters as” button, and directly access them via the Watchlist widget when logging on to their Dashboard.
  • The Latest Searches widget: Caters specifically to the Data Steward, focusing on their recent searches to enable them to pick up where they left off.
    The Most Popular Items widget: The most consulted and widely used Items within the Data Steward’s Perimeter by other users. Each Item is clickable, giving instant access to its contents.


View the Feature Note


New Steward Dashboard Studio

Deliver trusted, secure, and compliant information across the organization

Data Sampling on Datasets


For select connections, it is possible to get Data Sampling for Datasets. Our Data Sampling capabilities allow users to obtain representative subsets of existing datasets, offering a more efficient approach to working with large volumes of data. With Data Sampling activated, administrators can configure fields to be obfuscated, mitigating the risk of displaying sensitive personal information.

This feature carries significant importance to our customers, as it enables users to save valuable time and resources by working with smaller, yet representative, portions of extensive datasets. This also allows early identification of data issues, thereby enhancing overall data quality and subsequent analyses. Most notably, the capacity to obfuscate fields addresses critical privacy and security concerns, allowing users to engage with anonymized or pseudonymized subsets of sensitive data, ensuring compliance with privacy regulations, and safeguarding against unauthorized access.

Data Sampling Zeenea Studio

Powerful Lineage capabilities


In 2022, we made a lot of improvements to our Lineage graph. Not only did we simplify its design and layout, but we also made it possible for users to display only the first level of lineage, expand and close the lineage on demand, and get a highlighted view of the direct lineage of a selected Item.

This year we made significant other UX changes, including the possibility to expand or reduce all lineage levels in one click, hide the data processes that don’t have at least one input and one output, and easily view the connections via a tooltip for connections that have long names.

However, the most notable release is the possibility to have Field-level lineage! Indeed, it is now possible to retrieve the input and output Fields of tables and reports, and for more context, add the operation’s description. Then, users can directly view their Field level transformations over time in the Data Lineage graph in both Zeenea Explorer and Zeenea Studio.

Field Level Lineage Zeenea Studio 2

Data Quality Information on Datasets


By leveraging GraphQL and knowledge graph technologies, Zeenea Data Discovery Platform provides a flexible approach to integrating best-of-breed data quality solutions. It synchronizes datasets via simple query and mutation operations from third-party DQM tool via our Catalog API capabilities. The DQM tool will deliver real-time data quality scan results to the corresponding dataset within Zeenea, enabling users the ability to conveniently review data quality insights directly within the catalog.

This new feature includes:

  • A Data Quality tab in your Dataset’s detail pages, where users can view its Quality checks as well as the type, status, description, last execution date, etc.
  • The possibility to view more information on the Dataset’s quality directly in the DQM tool via the “Open dashboard in [Tool Name]” link.
  • A data quality indicator of Datasets directly displayed in the search results and lineage.


View the Feature Note

Zeenea Explorer Data Quality Graph

Enable end-to-end connectivity with all their data sources


At Zeenea, connect to all your data sources in seconds. Our platform’s built-in scanners and APIs enable organizations to automatically collect, consolidate, and link metadata from their data ecosystem. This year, we made significant enhancements to our connectivity to enable our customers to build a platform that truly represents their data ecosystem.

Catalog Management APIs


Recognizing the importance of API integration, Zeenea has developed powerful API capabilities that enable organizations to seamlessly connect and leverage their data catalog within their existing ecosystem.

In 2023, Zeenea developed Catalog APIs, which help Data Stewards with their documentation tasks. These Catalog APIs include:

Query operations to retrieve specific catalog assets: Our API query operations include the retrieval of a specific asset, using its unique reference or by its name & type, or retrieving a list of assets via connection or a given Item type. Indeed, Zeenea’s Catalog APIs enable flexibility when querying by being able to narrow results to not be overwhelmed with a plethora of information.

Mutation operations to create and update catalog assets: To save even more time when documenting and updating company data, Zeenea’s Catalog APIs enable data producers to easily create, modify, and delete catalog assets. It enables the creation, update, and deletion of Custom Items and Data Processes as well as their associated metadata, and update Datasets and Data Visualizations. This is also possible for Contacts. This is particularly important when users leave the company or change roles – data producers can easily transfer the information that was linked to a particular person to another.


Read the Feature Note

Property & Responsibility Codes management


Another feature that was implemented was the ability to add code to properties & responsibilities to easily use them in API scripts for more reliable queries & retrievals.

For all properties and responsibilities that were built in Zeenea (e.g.: Personally Identifiable Information) or harvested from connectors, it is possible to modify its name and description to better suit the organization’s context.

Property Responsibility Codes Studio

More than a dozen more connectors to the list


At Zeenea, we develop advanced connectors to automatically synchronize metadata between our data discovery platform and all your sources. This native connectivity saves you the tedious and challenging task of manually finding the data you need for a specific business use case that often requires access to scarce technical resources.

In 2023 alone, we developed over a dozen new connectors! This achievement underscores our agility and proficiency in swiftly integrating with diverse data sources utilized by our customers. By expanding our connectivity options, we aim to empower our customers with greater flexibility and accessibility.


View our connectors

What is sensitive data discovery?

What is sensitive data discovery?

by Zeenea Software | Nov 12, 2023 | Data Compliance, Data Inspiration

Protecting sensitive data stands as a paramount concern for data-centric enterprises. To navigate this landscape effectively, one must first embark on the meticulous task of accurately cataloging sensitive data – this is the essence of sensitive data discovery.

Data confidentiality is a core tenet, yet not all data is created equal. It is imperative to differentiate between sensitive data and information requiring heightened security and care. Sensitive data encompasses a broad spectrum, including personal and confidential details whose exposure could lead to significant harm to individuals or organizations. This encompasses various forms of information, such as medical records, social security numbers, financial data, biometric data, and details about personal attributes like sexual orientation, religious beliefs, and political opinions, among others.

The handling of sensitive data necessitates relentless adherence to rigorous security and privacy standards. As part of your organizational responsibilities, you are required to implement robust security measures to thwart data leaks, prevent unauthorized access, and shield against data breaches. This entails employing techniques such as encryption, two-factor authentication, access management, and other advanced cybersecurity practices.

Once this foundational principle is acknowledged, a pivotal question remains: Does your business engage in the collection and management of sensitive data? To ascertain this, you must undertake the identification and protection of sensitive data within your organization.

How do you define and distinguish between data discovery and sensitive data discovery?


Data discovery is the overarching process of identifying, collecting, and analyzing data to extract valuable insights and information. It involves exploring and comprehending data in its entirety, recognizing patterns, generating reports, and making informed decisions based on the findings. Data discovery is fundamental for enhancing business operations, improving efficiency, and facilitating data-driven decision-making. Its primary objective is to maximize the utility of available data for various organizational purposes.

On the other hand, sensitive data discovery is a more specialized subset of data discovery. It specifically centers on the identification, protection, and management of highly confidential or sensitive data. Sensitive data discovery involves pinpointing this specific type of data within an organization, categorizing it, establishing appropriate security protocols and policies, and safeguarding it against potential threats, such as data breaches and unauthorized access.

What is considered sensitive data?


Since the enforcement of the GDPR in 2018, even seemingly harmless data can be deemed sensitive. However, it’s important to understand that sensitive data has a specific definition. Here are some concrete examples.

Sensitive data, to begin with, includes Personally Identifiable Information, often referred to as PII. This category covers crucial data like names, social security numbers, addresses, and telephone numbers, which are essential for the identification of individuals, whether they are your customers or employees.

Moreover, banking data, such as credit card numbers and security codes, holds a high degree of sensitivity, given its attractiveness to cybercriminals. Customer data, encompassing purchase histories, preferences, and contact details, is invaluable to businesses but must be diligently safeguarded to protect the privacy of your customers.
Likewise, health data, consisting of medical records, diagnoses, and medical histories, stands as particularly sensitive due to its deeply personal nature and its vital role in the realm of healthcare.

However, the realm of sensitive data extends far beyond these examples. Legal documents, such as contracts, non-disclosure agreements, and legal correspondence, house critical legal information and thus must remain confidential to preserve the interests of the parties involved. Depending on the nature of your business, sensitive data can encompass a variety of critical information types, all necessitating robust security measures to ward off unauthorized access or potential breaches.

What are the different methodologies associated with the discovery of sensitive data?


The discovery of sensitive data entails several essential methodologies aimed at its accurate identification, protection, management, and adherence to regulatory requirements. These methodologies play a crucial role in securing sensitive information:

Identification and Classification


This methodology involves pinpointing sensitive data within the organization and categorizing it based on its level of confidentiality. It enables the organization to focus its efforts on data that requires heightened protection.

Data Profiling


Data profiling entails a detailed analysis of the characteristics and attributes of sensitive data. This process enhances understanding, helping to identify inconsistencies, potential errors, and risks associated with the data’s use.

Data Masking


Data masking, also known as data anonymization, is pivotal for safeguarding sensitive data. This technique involves substituting or masking data in a way that maintains its usability for legitimate purposes while preserving its confidentiality.

Regulatory Compliance


Complying with laws and regulations pertaining to the protection of sensitive data is a strategic imperative. Regulatory frameworks like the GDPR in Europe or HIPAA in the United States establish stringent standards that must be followed. Non-compliance can result in significant financial penalties and reputation damage.

Data Retention and Deletion


Effective management of data retention and deletion is essential to prevent excessive data storage. Obsolete information should be securely and legally disposed of in accordance with regulations to avoid data hoarding.

Specific Use Cases


Depending on the specific needs of particular activities or industries, additional approaches can be implemented. These may include data encryption, auditing of access and activities, security monitoring, and employee awareness programs focused on data protection.


Managing sensitive data is a substantial responsibility, demanding both rigor and an ongoing commitment to data governance. It necessitates a proactive approach to ensure data security and compliance with ever-evolving data protection standards and regulations.

[Press Release] Consulting firm Amura IT announces a new strategic alliance with Zeenea

[Press Release] Consulting firm Amura IT announces a new strategic alliance with Zeenea

by Anthony Corbeaux | Jul 19, 2023 | News & events

This agreement marks a significant milestone in the strategy of both companies by combining Amura IT’s expertise in developing solutions in its three lines of business: Digital, Intelligence, and AI, with Zeenea’s innovative data catalog and data discovery platform.

Madrid, July 19th, 2023 – Zeenea, a leading company in active metadata management and data discovery, has reached an agreement with consulting firm Amura IT to sign a strategic alliance.

Amura IT, recognized for its over 20 years of experience as a technology group, has demonstrated its ability to help companies in their digital transformation. It has three distinct service lines: Amura IA, a recently created line, Amura Digital to provide a satisfying customer and business experience, adapted to the new digital era, and finally Amura Intelligence, whose objective is to assist companies in their transformation with Analytics and Big Data solutions. It is within this line of business where the alliance with Zeenea would primarily fall.

The integration of Zeenea’s intuitive technology will enable Amura IT to offer data cataloging and data discovery solutions to a larger number of users, regardless of their technical knowledge. At the same time, this partnership will allow Zeenea to expand its reach to a broader user base locally in Spain.

Richard Mathis, VP of Sales at Zeenea and director of business development in Spain and Portugal, expressed:

“We are delighted to join forces with Amura IT, a leading specialist in technology consulting and digital transformation in the Spanish and Portuguese markets. The majority of Zeenea’s operations are already taking place overseas, and this alliance will support our efforts and commitment to bring a strong local presence and expertise to these key southern European markets. We look forward to building strong and valuable relationships with Amura IT and organizations eager to unlock the full potential of their data.

José Antonio Fernández, director of business development and alliances at Amura IT, highlighted the strategic importance of this partnership:

“The alliance with Zeenea is a decisive step in our strategy, as it will allow us to enhance our capabilities and offer innovative solutions focused on metadata cataloging, search, and lineage. Our clients will be able to access the past, present, and future of their data assets in an agile and effective manner.”

With the signing of this agreement, Zeenea and Amura IT demonstrate their shared commitment to providing cutting-edge solutions and helping companies maximize the value of their enterprise data. This strategic partnership promises to drive digital transformation and improve data-driven decision-making for their clients in Spain and expand beyond our borders.


About Amura IT

Amura IT is a technology consulting firm that was established in 2019 to offer solutions that support digital transformation in organizations. It currently offers three lines of business: Amura Intelligence, to assist companies in their transformation with Analytics and Big Data solutions primarily; Amura Digital, to provide a satisfying customer and business experience adapted to the new digital era; and Amura IA, focused on solutions based on artificial intelligence.

Key takeaways from the Zeenea Exchange 2023: Unlocking the power of the enterprise Data Catalog

Key takeaways from the Zeenea Exchange 2023: Unlocking the power of the enterprise Data Catalog

by Zeenea Software | Jul 17, 2023 | Data Catalog, News & events

Each year, Zeenea organizes exclusive events that bring together our clients and partners from various organizations fostering an environment for collaborative discussions and the sharing of experiences and best practices. The third edition of the Zeenea Exchange France was held in the heart of Paris’ 8th arrondissement with our French-speaking customers and partners, whereas the first edition of the Zeenea Exchange International was an online event gathering clients from all around the world.

In this article, we will take a look back and give key insights into what was discussed during these client round tables – both taking place in June 2023 – with the following topic: “What are your current & future uses and objectives for your data catalog initiatives?”.

What motivated our clients for implementing a data catalog solution?

Exploding volumes of information


Most of our clients faced the challenge of having to collect and inventory large amounts of information from different sources. Indeed, a significant number of our participants embarked on their data-driven journey by adopting a Data Lake or other platform to store their information. However, they soon realized that it became difficult to manage this large ocean of data with questions such as “What data do I have? Where do they come from? Who is responsible for this data? Do I have the right to see this data? What does this data mean?” began to arise.

Consequently, finding a solution that could automate the centralization of enterprise information and provide accurate insights about their data became a crucial objective, leading to the search for a data catalog solution.

Limited data access


Another common data challenge that arose was that of data access. Prior to centralizing their data assets into a common repository, many companies faced the issue of disparate information systems, dedicated to different business lines or departments within the organization. Therefore, data were kept in silos, making it difficult, even impossible, for efficient reporting or communication around their information. The need for making data available to all was another key reason why our clients searched for a solution that could democratize data access to those who need to access it.

Unclear roles & responsibilities


Another major reason for searching for a data catalog was to give clear roles and responsibilities to their different data consumers and producers. The purpose of a data catalog is to centralize and maintain up-to-date contact information for each data asset, providing clear visibility on the appropriate person or entity to approach when questions arise regarding a specific set of data.

What are the current uses & challenges regarding their data catalog initiatives?

A lack of a common language


Creating a shared language for data definitions and business concepts is a significant challenge faced by many of our clients. This issue is particularly prevalent when different business lines or departments lack alignment in defining specific concepts or KPIs. For example, some KPIs may lack clear definitions or multiple versions of the same KPI may exist with different definitions. Given some of our clients’ complex data landscapes, achieving alignment among stakeholders regarding the meaning and definitions of concepts poses significant challenges and remains a crucial endeavor.

More autonomy to the business users


The implementation of a data catalog has brought a significant increase in autonomy for business users across the majority of our clients. By utilizing Zeenea, which offers intuitive search and data discovery capabilities across the organization’s data landscape, non-technical users now have a user-friendly and efficient means to locate and utilize data for their reports and use cases. One client in the banking industry expressed how the data catalog accelerated the search, discovery, and acquisition of data. Overall it improved data understanding, facilitated access to existing data, and enhanced the overall quality analysis process, thereby instilling greater trust in the data for users.

Catalog adoption remains difficult


Another significant challenge faced by some of our clients is the difficulty in promoting data catalog adoption and fostering a data-driven culture. This resistance can be attributed to many users being unfamiliar with the benefits that the data catalog can provide. Establishing a data-driven culture requires dedicated efforts to explain the advantages of using a data catalog. This can be accomplished by promoting it to different departments through effective communication channels, organizing training sessions, and highlighting small successes that demonstrate the value of the tool throughout the organization.

The benefits of automation


The data catalog offers a valuable feature of automating time-consuming tasks related to data collection, which proves to be a significant strength for many of our clients. Indeed, Zeenea’s APIs enable the retrieval of external metadata from different sources, facilitating the inventorying of glossary terms, ownership roles information, technical and business quality indicators from data quality tools, and more. Furthermore, it was expressed that the data catalog aids in expediting IT transformation programs and the integration of new systems, enabling better planning for new integrations.

The next steps in their data cataloging journey

Towards a Data Mesh approach


Some of our customers, particularly those who attended the International Edition, have shown interest in adopting a Data Mesh approach. According to a conducted poll during the event, 66% of the respondents are either considering or currently deploying a Data Mesh approach within their organizations. A particular client shared they have data warehouses and Data Lakes, but the lack of transparency regarding data ownership and usage within different domains prompted the need for more autonomy and a shift from a centralized Data Lake to a domain-specific architecture.

Zeenea as a central repository


Many of our clients, regardless of their industry or size, leverage the data catalog as a centralized repository for their enterprise data. This approach helps them consolidate information from multiple branches or subsidiaries into a single platform, avoiding duplicates and ensuring data accuracy. Indeed, the data catalog’s objective is to enable our clients to find data across departments, facilitating the use of shared solutions and enhancing data discovery and understanding processes.

Using the data catalog for compliance initiatives


Compliance initiatives are indeed gaining importance for organizations, particularly in industries such as banking and insurance. In a poll conducted during the International Edition, we found that 50% of the respondents currently use the data catalog for compliance purposes, while the other 50% may consider using it in the future.

A client who expressed that compliance is a priority shared that they are considering building an engine to query and retrieve information about the data they have on an individual if requested. Others have future plans to leverage the data catalog for compliance and data protection use cases. They aim to classify data and establish a clear understanding of its lineage, enabling them to track where data originates, how it flows, and where it is utilized.

If any of this feedback and testimonials echo your day-to-day experience within your company, please don’t hesitate to contact us. We’d be delighted to welcome you to the Zeenea user community and invite you to our next Zeenea Exchange events.

Contact us

What are the differences between a Data Analyst and a Business Analyst?

What are the differences between a Data Analyst and a Business Analyst?

by Zeenea Software | Apr 29, 2021 | Data Inspiration

So similar yet, so different! The roles of a Data Analyst and a Business Analyst are very often unclear, even though their missions are very different. Their functions being more complementary than not, let’s have a look at these two highly sought-after profiles. 

Data is now at the heart of all decision-making processes. According to a study conducted by IDC on behalf of Seagate, the volume of data generated by companies worldwide is expected to reach 175 Zetabytes by 2025…

In this context, collecting information is no longer enough. What’s important is the ability to draw conclusions from this data to make informed decisions. 

However, the interpretation methods used and the way to exploit data can be very different. The ever-changing nature of data has created new domains of expertise with titles and functions that are often misleading or confusing.

What separates the missions of the Data Analyst to those of the Business Analyst may seem tenuous. And yet, their functions, roles, and responsibilities are very different… and complementary! 


Business Analyst & Data Analyst: a common ground 

If the role of a Business Analyst and of a Data Analyst are sometimes unclear, it is because their missions are inherently linked to creating value with enterprise information. 

What distinguishes them is the nature of this information.

While a Data Analyst works on numerical data, coming from the company’s information systems, the Business Analyst can exploit both numerical and non-numerical data. 

A data analyst must ensure the processing of data within the company to extract valuable analytic trends that enable teams to adapt to the organization’s strategy. The business analyst then provides answers to concrete business issues based on a sample of data that may exceed the data portfolio generated by the company. 


A wide range of skills

Data Analysts must have advanced skills in mathematics and statistics. A true expert in databases and computer language, this data craftsman often holds a degree in computer engineering or statistical studies.

The Business Analyst, on the other hand, has a less data-oriented profile (in the digital sense of the term). If they use information to fulfill their missions, they will always be in direct contact with management and all of the company’s business departments. Although the Business Analyst may have skills in algorithms, SQL databases or even master XML language, they are not necessarily an essential prerequisite. 

A Business Analyst must therefore be able to demonstrate a real know-how to communicate, listen, hear and understand the company’s challenges. For a Data Analyst on the other hand, technical skills are essential. SQL language, Python, Data modeling and Power BI, IT and analytics expertise will allow them to exploit the data in an operational dynamic.


The differences in responsibilities and objectives

The Data Analyst’s day-to-day work consists above all of enhancing the company’s data assets. To this end, he or she will be responsible for data quality, data cleansing and data optimization.

Their objective? To provide internal teams with usable databases in the best conditions and to identify all the improvement levers likely to impact the data project. 

The Business Analyst will benefit from the work of the Data Analyst and will contribute to making the most of it by putting the company’s native data into perspective with peripheral data and information. By reconciling and enhancing different sources of information, the Business Analyst will contribute to the emergence of new market, organizational or structural opportunities to accelerate the company’s development.

In short, the Data Analyst is the day-to-day architect of the company’s data project. The Business Analyst is the one who intervenes, in the long run, on the business strategy. To meet this challenge, he or she bases his or her action on the quality of the data analyst’s work. 


Two complementary missions, two converging profiles that will allow organizations to make the most of their data culture! 


Marquez: the metadata discovery solution at WeWork

Marquez: the metadata discovery solution at WeWork

by Zeenea Software | Dec 10, 2020 | Data Inspiration, Metadata Management

Created in 2010, WeWork is a global office & workspace leasing company. Their objective is to provide space for teams of any sizes including startups, SMEs, and major corporations, to collaborate. In order to achieve this, what WeWork provides can be broken down into three different categories: 


    • Space: To ensure companies with optimal space, WeWork must provide the appropriate infrastructure, which consists of booking rooms for interviews / one on ones or even entire buildings for huge corporations. They also must make sure they are equipped with the appropriate facilities such as kitchens for lunch and coffee breaks, bathrooms, etc.     
    • Community: Via WeWork’s internal application, the firm enables WeWork members to connect with one another, whether it’s local within their own WeWork space, or globally. For example, if a company is in need of feedback for a project from specific job titles (such as a developer or UX designer), they can directly ask for feedback and suggestions via the application to any member, regardless of their location.  
    • Services: WeWork also provides their members with full IT services if there are any problems as well as other services such as payroll services, utility services, etc.

In 2020, WeWork represents:

  • More than 600,000 memberships 
  • Locations in 127 cities in 33 different countries,
  • 850 offices worldwide,
  • Generated $1.82 billion in revenue.

It is clear that WeWork works with all sorts of data from their staff and customers, whether that be individuals or companies. The huge firm was therefore in need of a platform where their data experts could view, collect, aggregate, and visualize their data ecosystem’s metadata. This was resolved by the creation of Marquez. 

This article will focus on WeWork’s implementation of Marquez mainly through free & accessible documentation provided on various websites, to illustrate the importance of having an enterprise-wide metadata platform in order to truly become data-driven.  


Why manage & utilize metadata?  

In his talk “A Metadata Service for Data Abstraction, Data Lineage & Event-based Triggers” at the Data Council back in 2018, Willy Lulciuc, Software Engineer for the Marquez project at WeWork explained that metadata is crucial for three reasons:

Ensuring data quality: when data has no context, it is hard for data citizens to trust their data assets: are there fields missing? Is the documentation up to date? Who is the data owner and are they still the owner? These questions are answered through the use of metadata.

Understanding Data lineage: knowing your data’s origins and transformations are key to being able to truly know what stages your data went through over time.

Democratization of datasets: According to Willy Lulciuc, democratizing data in the enterprise is critical! Having a central portal or UI available for users to be able to search for and explore their datasets is one of the most important ways companies can truly create a self-service data culture. 

marquez-why-manage-and-utilize-metadata

To sum up: creating a healthy data ecosystem! Willy explains that being able to manage and utilize metadata creates a sustainable data culture where individuals no longer need to ask for help to find and work with the data they need. In his slide, he goes through three different categories that make up a healthy data ecosystem:

  1. Being a self service ecosystem, where data and business users have the possibility to discover the data and metadata they need, and explore the enterprise’s data assets when they don’t know exactly what they are searching for. Providing data with context, gives the ability to all users and data citizens to effectively work on their data use cases.
  2. Being self-sufficient by enabling data users the freedom to experiment with their datasets as well as having the flexibility to work on every aspect of their datasets whether they input or output datasets for example.

  3. And finally, instead of relying on certain individuals or groups, a healthy data ecosystem allows for all employees to be accountable for their own data. Each user has the responsibility to know their data, their costs (is this data producing enough value?) as well as keeping track of their data’s documentation in order to build trust around their datasets. 
marquez-a-healthy-data-ecosystem

Room booking pipeline before

As mentioned above, utilizing metadata is crucial for data users to be able to find the data they need. In his presentation, Willy shared a real situation to prove metadata is essential: WeWork’s data pipeline for booking a room. 

 For a “WeWorker”, the steps are as follows:

  1. Find a location (the example was a building complex in San Francisco)
  2. Choose the appropriate room size (usually split into the number of attendees – in this case they chose a room that could greet 1 – 4 people)
  3. Choose the date for when the booking will take place
  4. Decide on the time slot the room is booked for as well as the duration of the meeting
  5. Confirm the booking

Now that we have an example of how their booking pipeline works, Willy proceeds to demonstrate how a typical data team would operate when wanting to pull out data on WeWork’s bookings. In this case, the example exercise was to find the building that held the most room bookings, and extract that data to send over to management. The steps he stated were the following:

  • Read the room bookings from a data source (usually unknown), 
  • Sum up all of the room bookings and return the top locations, 
  • Once the top location is calculated, the next step is to write it into some output data source,
  • Run the job once a hour,
  • Process the data through .csv files and store it somewhere.

However, Willy stated that even though these steps seem like it’s going to be good enough, usually, there are problems that occur. He goes over three types of issues during the job process:

  1. Where can I find the job input’s dataset?
  2. Does the dataset have an owner? Who is it? 
  3. How often is the dataset updated? 

Most of these questions are difficult to answer and jobs end up failing… Without being sure and trusting this information, it can be hard to present numbers to management ! These sorts of problems and issues are what made WeWork develop Marquez!

What is Marquez?

Willy defines the platform as an “open-sourced solution for the aggregation, collection, and visualization of metadata of [WeWork’s] data ecosystem”. Indeed, Marquez is a modular system and was designed as a highly scalable, highly extensible platform-agnostic solution for metadata management. It consists of the following components:

Metadata Repository: Stores all job and dataset metadata, including a complete history of job runs and job-level statistics (i.e. total runs, average runtimes, success/failures, etc).

Metadata API: RESTful API enabling a diverse set of clients to begin collecting metadata around dataset production and consumption.

Metadata UI: Used for dataset discovery, connecting multiple datasets and exploring their dependency graph.

Marquez’s design

Marquez provides language-specific clients that implement the Metadata API. This enables a  diverse set of data processing applications to build a metadata collection. In their initial release, they provided support for both Java and Python. 

The Metadata API extracts information around the production and consumption of datasets. It’s a stateless layer responsible for specifying both metadata persistence and aggregation. The API allows clients to collect and/or obtain dataset information to/from the Metadata Repository.

Metadata needs to be collected, organized, and stored in a way to allow for rich exploratory queries via the Metadata UI. The Metadata Repository serves as a catalog of dataset information encapsulated and cleanly abstracted away by the Metadata API.

According to Willy, what makes a very strong data ecosystem is the ability to search for information and datasets. Datasets in Marquez are indexed and ranked through the use of a search engine based keyword or phrase as well as the documentation of a dataset: the more a dataset has context, the more it is likely to appear first in the search results. Examples of a dataset’s documentation is its description, owner, schema, tag, etc. 

You can see more detail of Marquez’s data model in the presentation itself here → https://www.youtube.com/watch?v=dRaRKob-lRQ&ab_channel=DataCouncil 

marquez-data-model

The future of data management at WeWork

Two years after the project, Marquez has proven to be a big help for the giant leasing firm. They’re long term roadmap is to solely focus on their solution’s UI, by including more visualizations and graphical representations in order to provide simpler and more fun ways for users to interact with their data. 

They also provide various online communities via their Github page, as well as groups on LinkedIn for those who are interested in Marquez to ask questions, get advice or even report issues on the current Marquez version. 

Sources

A Metadata Service for Data Abstraction, Data Lineage & Event-based Triggers, WeWork. Youtube: https://www.youtube.com/watch?v=dRaRKob-lRQ&ab_channel=DataCouncil

29 Stunning WeWork Statistics – The New Era Of Coworking, TechJury.com:https://techjury.net/blog/wework-statistics/

Marquez: Collect, aggregate, and visualize a data ecosystem’s metadata, https://marquezproject.github.io/marquez/

Marquez: An Open Source Metadata Service for ML Platforms Willy Lulciuc

New white paper: “Data Discovery through the eyes of Tech Giants”

New white paper: “Data Discovery through the eyes of Tech Giants”

by Zeenea Software | Sep 21, 2020 | News & events

Learn about the data discovery solutions developed by various Tech Giants that enabled their data teams to understand and trust in their data assets. 

We’ve released today our new special edition white paper “Data Discovery through the eyes of Tech Giants” which focuses on the different data discovery platforms that were developed by huge tech corporations such as Airbnb, Uber, Spotify, to name a few. 

Thousands of datasets are being created each day, and enterprises find themselves struggling to understand and gain insights from their information. Usually messy, scattered and unorganized, data & analytics teams are found spending most of their time cleaning up a Big Data mess! In fact, many recent surveys still state that data science teams spend 80% of their time preparing and tidying their data instead of analyzing and reporting it. 

The numerous and diverse data added on a daily basis makes it extremely challenging, even impossible, to manually maintain data ingestion! These huge corporations therefore quickly understood that it was essential to put in place a repository of metadata that automated data discovery for their data and analytics teams to quickly find and understand their enterprise data.

We based our research on official documentation provided by these Tech Giants, which they shared across their corporate social media and blogging platforms. It goes into detail on how these enterprises came to developing their solutions, the characteristics of their platforms, and the next steps for each company.

The experiences of the organizations have largely inspired Zeenea in their data catalog’s value proposition to facilitate the discovery of information assets by data teams in the simplest and most intelligent way possible. 

Get to know the various data discovery platforms for free by downloading our latest white paper! 

data-discovery-mockup-EN-no-shadow
Download our white paper
What is data discovery?

What is data discovery?

by Zeenea Software | Jul 3, 2020 | Metadata Management

In this age where data is all around us, organizations have increasingly been investing in data management strategies in order to create value and gain competitive advantage. However, according to a study conducted by Gemalto in 2018, it was found that 65% of organizations can’t analyze or categorize all the consumer data they store.

It is therefore crucial for enterprises to look for solutions that allow them to seek out the value of their data from the metrics, insights and information by facilitating their data discovery journey.

Data discovery definition

Data discovery problems are everywhere in the enterprise, whether it’s in the IT, Business Intelligence or Innovation department. By integrating data discovery solutions, enterprises provide data access to all employees, enabling Data teams and Business analysts to understand and thus, collaborate on data related topics.

It is also very useful for enterprises seeking better compliance management. It allows organizations to know what data is personal/sensitive and where it can be found. In addition, data discovery can bolster innovation, as it unblocks essential information for satisfying customers and gaining competitive advantage.

From Manual to Smart Data Discovery

For 20 years, before advanced machine learning techniques, data specialists mapped their data using the sole brain power of humans! They critically thought out about what data they had, where it was stored, and what are the needs to be provided to the end customer. Data Stewards usually took care of data assets documentation rules and standards that guided the data discovery process. In these manual approaches, usually done using Excel sheets, people conceptualized and drew out maps to comprehend their data’s organization.

Nowadays, with the advancement of technology, the definition of data discovery includes automated ways of presenting data. Smart Data Discovery represents a new wave of data technologies that use augmented analytics, Machine Learning and Artificial Intelligence. It not only prepares, conceptualizes and integrates data, but also presents it through intelligent dashboards to reveal hidden patterns and business insights.

The benefits of data discovery

Enterprise data moves from one location to another in the speed of light, and is being stored in various data sources and storage applications. Employees and partners are accessing this data from anywhere and anytime, so identifying, locating and classifying your data in order to protect it and gain insights from it should be the priority!

The benefits of data discovery include:

  • A better understanding of enterprise data, where it is, who can access it and where, and how it will be transmitted,
  • Automatic data classification based on context,
  • Risk management and regulatory compliance,
  • Complete data visibility,
  • Identification, classification, and tracking of sensitive data,
  • The ability to apply protective controls to data in real time based on predefined policies and contextual factors

Data discovery enables enterprises to adequately assess the full data picture.

On one hand it helps implement the appropriate security measures to prevent the loss of sensitive data and avoid devastating financial and reputational consequences for the enterprise. On the other, it enables teams to dig deeper into the data to identify the specific items that reveal the answers and find ways to show answers. It’s a win-win situation!

Learn more about data discovery in our white paper: “Data Discovery through the eyes of Tech Giants”

Discover the various data discovery solutions developed by large Tech companies, some belonging to the famous “Big Five” or “GAFAM”, and how they helped them become data-driven.

data-discovery-mockup-EN-no-shadow
download our white paper

Build your citizen data scientist team

Build your citizen data scientist team

by Zeenea Software | Jun 8, 2020 | Metadata Management

”There aren’t enough expert data scientists to meet data science and machine learning demands, hence the emergence of citizen data scientists. Data and analytics leaders must empower “citizens” to scale efforts, or risk failure to secure data science as a core competency”. – Gartner 2019

As data science provides competitive advantages for organizations, the demand for expert data scientists is at an all-time high. However, supply remains pretty scarce for that demand! This limitation is a threat for enterprises’ competitiveness, and in some cases, their survival in the market.

In response to this challenge, an important analytical role providing a bridge between data scientists and business functions was born: the citizen data scientist.


What is a citizen data scientist?

Gartner defines the citizen data scientist as “an emerging set of capabilities and practices that allows users to extract predictive and prescriptive insights from data while not requiring them to be as skilled and technically sophisticated as expert data scientists”. A “Citizen Data Scientist” is not a job title. They are “power users” who can perform both simple and sophisticated analytical tasks.

Typically, citizen data scientists don’t have coding expertise but can nevertheless build models using drag-and-drop tools and run prebuilt data pipelines and models using tools such as Dataiku. Be aware: citizen data scientists do NOT replace expert data scientists! They bring their own expertise but do not have the specialized expertise for advanced data science.

The citizen data scientist is a role that has evolved as an “extension” from other roles within the organization! This means that organizations must develop a citizen data scientist persona. Potential citizen data scientists will vary based on their skills and interest in data science and machine learning. Roles that filter into the citizen data scientist category include:

  • Business analysts
  • BI Analysts / Developers
  • Data Analysts
  • Data Engineers
  • Application Developers
  • Business line manager


How to empower citizen data scientists?

As expert skills for data science initiatives tend to be quite expensive and difficult to come by, utilizing a citizen data scientist can be an effective way to close the current gap.

Here are ways you can empower your data science teams:


Break enterprise silos

As I’m sure you’ve heard this many times before, many organizations tend to operate independently in silos. Mentioned above, all of roles are important in an organization’s data management strategy, and they all have expressed interest in learning about data science and machine learning skills. However, most data science and machine learning knowledge is siloed in the data science department or specific roles. As a result, data science efforts are often invalidated and unleveraged. Lack of collaboration between data roles makes it difficult for citizens data scientists to access and understand enterprise data!

By establishing a community of both business and IT roles that provides detailed guidelines and/or resources allows enterprises to empower citizens data scientists. It is important for organizations to encourage the sharing of data science efforts throughout the organization and thus, break silos!


Provide augmented data analytics technology

Technology is fueling the rise of the citizen data scientist. Traditional BI vendors such as SAP, Microsoft and Tableau Software, provide advanced statistical and predictive analytics as part of their offerings. Meanwhile, data science and machine learning platforms such as SAS, H2O.ai and TIBCO Software, provide users that lack advanced analytics capabilities with “augmented analytics”. Augmented analytics leverages automated machine learning to transform how analytics content is developed, consumed and shared. It includes:

Augmented data preparation: machine learning automation to augment data profiling and quality, modeling, enrichment and data cataloguing.

Augmented data discovery: enables business and IT users to automatically find, visualize and analyse relevant information, such as correlations, clusters, segments, and predictions, without having to build models or write algorithms

Augmented data science and machine learning: automates key aspects of advanced analytics modeling such as feature selection, algorithm selection and time-consuming step processes.

By incorporating the necessary tools and solutions and extending resources and efforts, enterprises can empower citizen data scientists!


Empower citizen data scientists with a metadata management platform

Metadata management is an essential discipline for enterprises wishing to bolster innovation or regulatory compliance initiatives on their data assets. By implementing a metadata management strategy, where metadata is well-managed and correctly documented, citizen data scientists are able to easily find and retrieve relevant information from an intuitive platform.

Discover our tips for starting metadata management in only 6 weeks by downloading our new white paper “The effective guide to start metadata management”!

How a business glossary empowers your data scientists

How a business glossary empowers your data scientists

by Zeenea Software | May 26, 2020 | Metadata Management

In the data world, a business glossary is a sacred text that represents long hours of hard work and collaboration between the IT & business departments. In metadata management, it is a crucial part of delivering business value from data. According to Gartner, It is one of the most important solutions to put in place in an enterprise to support business objectives.

To help your data scientists with their machine learning algorithms and their data initiatives, a business glossary provides clear meanings and context to any data or business term in the company.

Back to basics: what is a business glossary?

A business glossary is a place where business and/or data terms are defined and accessible within the entire organization. As simple as it may sound, it is actually a common problem; not all employees agree or share a common understanding of even basic terms such as “contact” or “customer”.

Its main objectives, among others, are to:

  • Use the same definitions and create a common language between all employees,
  • Have a better understanding and collaboration between business and IT teams,
  • Associate business terms to other assets in the enterprise and offer an overview of their different connections,
  • Elaborate and share a set of rules regarding data governance.

Organizations are therefore able to have information as a second language.

How does a business glossary benefit your data scientists?

Centralized business information allows to share what is essentially tribal knowledge, around an enterprise’s data. In fact, it allows Data Scientists to make better decisions when choosing which datasets to use. It also allows:

A data literate organization

Gartner predicts that by 2023, data literacy will become an explicit and necessary driver of business value, demonstrated by its formal inclusion in over 80% of data and analytics strategies and change management programs. Increasingly, organizations are realizing this and beginning to look at data and analytics in a new way.

As part of the Chief Data Officer job description, it is essential that all parts of the organization can understand data and business jargons. It helps all parts of the organization to better understand a data’s meaning, context, and usages. So by putting in place a business glossary, data scientists are able to efficiently collaborate with all departments in the company, whether IT or business. There are less communication errors and thus they participate in the construction and improvement of knowledge of the enterprise’s data assets.

The implementation of a data culture

Closely related to data literacy, data culture refers to a workplace environment where decisions are made through emphatic and empirical data proof. In other words, executives make decisions based on data evidence, and not just on instinct.

A business glossary promotes data quality awareness and overall understanding of data in the first place. As a result, the environment becomes more data-driven. Furthermore, business glossaries can help data scientists gain better visibility into their data.

An increase in trusting data

A business glossary ensures that the right definitions are used effectively for the right data. It will assist with general problem solving when data misunderstandings are identified. When all datasets are correctly documented with the correct terminology that is understood by all, it increases overall trust in enterprise data, allowing data scientists to efficiently work on their data projects.

Their time is less spent on cleaning and organizing data, but rather on bringing valuable insights to maximize business value!


Implement a Business Glossary with Zeenea

Zeenea provides a business glossary within our data catalog. Our business glossary automatically connects and imports your glossaries and dictionaries in our tool with our APIs. You can also manually create a glossary within Zeenea’s interface!

Check our business glossary benefits for your data scientists!

Contact us

WhereHows: A  data discovery and lineage portal for LinkedIn

WhereHows: A data discovery and lineage portal for LinkedIn

by Zeenea Software | Apr 20, 2020 | Data Inspiration, Metadata Management

Metadata is becoming increasingly important for modern data-driven enterprises. In a world where the data landscape is increasing at a rapid pace, and information systems are more and more complex, organizations in all sectors have understood the importance of being able to discover, understand and trust in their data assets.

Whether your business is in the streaming industry such as Spotify or Netflix , the ride sharing industry such as Uber or Lyft, or even the rental business like Airbnb, it is essential for data teams to be equipped with the right tools and solutions that allow them to innovate and produce value with their data.

In this article, we will focus on WhereHows, an open source project led by the LinkedIn data team, that works by creating a central repository and portal for people, processes, and knowledge around data. With more than 50 thousand datasets, 14 thousand comments, and 35 million job executions and related lineage information, it is clear that LinkedIn’s data discovery portal is a success.


First, LinkedIn key statistics

Founded by Reid Hoffman, Allen Blue, Konstantin Guericke, Eric Ly, and Jean-Luc Vaillant in 2003 in California, the firm started out very slowly. In 2007, they finally became profitable, and in 2011 had more than 100 million members worldwide.

As of 2020, LinkedIn significantly grew:

  • More than 660 million LinkedIn members worldwide, with 206 million active users in Europe,
  • More than 80 million users on LinkedIn Slideshare,
  • More than 9 billion content impressions,
  • 30 millions companies registered worldwide.

LinkedIn is definitely a must-have professional social networking application for recruiters, marketers, and even sales professionals. So, how does the Web Giant keep up with all of this data?


How it all started

Like most companies with a mature BI ecosystem, Linkedin started out with a data warehouse team, responsible for integrating various information sources into consolidated golden datasets. As the number of datasets, producers and consumers grew, the team increasingly felt overwhelmed by the colossal amount of data being generated each day. Some of their questions were:

  • Who is the owner of this data flow?
  • How did this data get here?
  • Where is the data ?
  • What data is being used ?

In response, Linkedin decided to build a central metadata repository to capture their metadata across all systems and surface it through a unique platform to simplify data discovery: WhereHows!

What is WhereHows exactly?

Linkedin-WhereHows-1

WhereHows integrates with all data processing environments and extracts metadata from them.

Then, it surfaces this information via two different interfaces:

  1. A web application that enables navigation, searching, lineage visualization, discussions, and collaboration,
  2. An API endpoint that empowers the automatization of other data processes and applications.

This repository enables LinkedIn to solve problems around data lineage, data ownership, schema discovery, operational metadata mashup, data profiling, and cross-cluster comparison. In addition, they implemented machine-based pattern detection and association between the business glossary and their datasets, and created a community based on participation and collaboration that enables them to maintain metadata documentation by encouraging conversations and pride in ownership.

There are three major components of WhereHows:


  1. A data repository that stores all metadata
  2. A web server that surfaces data through API and UI
  3. A backend server that fetches metadata from other information sources
linkedin-wherehows--3

How does WhereHows work?

The power of WhereHows comes from the metadata it collects from Linkedin’s data ecosystem. It collects the following metadata:

  • Operational metadata, such as jobs, flows, etc.
  • Lineage information, which is what connects jobs datasets together,
  • The information catalogued such as the dataset’s location, its schema structure, ownership, create date, and so on.

How they use metadata

WhereHows uses a universal model that enables data teams to better leverage the value from the metadata; for example, by conducting a search across the different platforms based on different aspects of datasets.

Also, the metadata in a dataset and the job operational metadata are two endpoints. The lineage information connects them together and enables data teams to trace from a datasets/jobs to its upstream/downstream jobs/datasets. If the entire data ecosystem is collected into WhereHows, they can trace the data flow from start to finish!

How they collect metadata

The method used to collect metadata depends on the source. For example, Hadoop datasets have scraper jobs that scan through HDFS folders and files, reads the metadata, then stores it back.

For schedulers such as Azkaban, they connect their backend repository to get the metadata, aggregate it and transform it to the format they need, then load it into WhereHows. For the lineage information, they parse the log of a MapReduce job and a scheduler’s execution log, then combine that information together to get the lineage.


What’s next for WhereHows?

Today, WhereHows is actively used at Linkedin as not only a metadata repository, but also to automate other data projects such as automated data purging for compliance. In 2016, they integrated with systems down below:

In the future, Linkedin’s data teams hope to broaden their metadata coverage by integrating more systems such as Kafka or Samza. They also plan on integrating with data lifecycle management and provisioning systems like Nuage or Goblin to enrich the metadata. WhereHows has not said its final word!

Sources:


  • 50 of the Most Important LinkedIn Stats for 2020: https://influencermarketinghub.com/linkedin-stats/
  • Open Sourcing WhereHows: A Data Discovery and Lineage Portal:
    https://engineering.linkedin.com/blog/2016/03/open-sourcing-wherehows–a-data-discovery-and-lineage-portal

Learn more about data discovery solutions in our white paper: “Data Discovery through the eyes of Tech Giants”

Discover the various data discovery solutions developed by large Tech companies, some belonging to the famous “Big Five” or “GAFAM”, and how they helped them become data-driven.

data-discovery-mockup-EN-no-shadow
download our white paper

How Spotify improved their Data Discovery for their Data Scientists

How Spotify improved their Data Discovery for their Data Scientists

by Zeenea Software | Mar 19, 2020 | Data Inspiration, Metadata Management

As the world leader in the music streaming market, it is without question that the huge firm is driven by data.

Spotify has access to the biggest collections of music in the world, along with podcasts and other audio content.

Whether they’re considering a shift in product strategy or deciding which tracks they should add, Spotify says that “data provides a foundation for sound decision making”.

Spotify in numbers

Founded in 2006 in Stockholm, Sweden, by Daniel Ek and Martin Lorentzon, the leading music app’s goal was to create a legal music platform in order to fight the challenge of online music piracy in the early 2000s.

Here are some statistics & facts about Spotify in 2020:

  • 248 million active users worldwide,
  • 20,000 songs are added per day on their platform,
  • Spotify has 40% share of the global music streaming market,
  • 20 billion hours of music were streamed in 2015

These numbers not only represent Spotify’s success, but also the colossal amounts of data that is generated each year, let alone each day! To enable their employees, or as they call them, Spotifiers, to make faster and smarter decisions, Spotify developed Lexikon.

Lexikon is a library of data and insights that helps employees find and understand their data and knowledge generated by their expert community.


What were the data issues at Spotify?

In their article How We Improved Data Discovery for Data Scientists at Spotify, Spotify explains that they started their data strategy by migrating data to the Google Cloud Platform, and saw an explosion of their datasets. They were also in the process of hiring many data specialists such as data scientists, analyst, etc. However, they explain that datasets lacked clear ownership and had little-to-no documentation, making it difficult for these experts to find them.

The next year, they released Lexikon, as a solution for this problem.

Their first release allowed their Spotifiers to search and browse through available BigQuery tables as well as discover past researches and analysis. However, months after the launch, their data scientists were still reporting data discovery as a major pain point, spending most of their time trying to find their datasets therefore delaying informed decision-making.

Spotify decided then to focus on this specific issue by iterating on Lexikon, with the unique goal to improve data discovery experience for data scientists.

How does Lexikon data discovery work?

In order for Lexikon to work, Spotify started out by conducting research on their users, their needs as well as their pain points. In doing so, the firm was able to gain a better understanding of their users intent and use this understanding to drive product development.


Low intent data discovery

For example, you’ve been in a foul mood so you’d like to listen to music to lift your spirits. So, you open Spotify, browse through different mood playlists and put on the “Mood Booster” playlist.

Tah-dah! This is an example of low-intent data discovery, meaning your goal was reached without extremely strict demands.

To put this into Spotify’s data scientists context, especially new ones, their low intent data discovery would be:

  • find popular datasets used widely across the company,
  • find datasets that are relevant to the work my team is doing, and/or
  • find datasets that I might not be using, but I should know about.

So in order to satisfy these needs, Lexikon has a customizable homepage to serve personalized recommendations to users. The homepage recommends potentially relevant, automatically generated suggestions for datasets such as:


  • popular datasets used within the company,
  • dataset recently used by the user,
  • datasets widely used by the team the user belongs to.

High intent data discovery

To explain this in simple terms, Spotify uses the example of hearing a song, and researching it over and over in the app until you finally find it, and listen to it on repeat. This is high intent data discovery!

A data scientist at Spotify with high intent has specific goals and is likely to know exactly what they are looking for. For example they might want to:

  • find a dataset by its name,
  • find a dataset that contains a specific schema field,
  • find a dataset related to a particular topic,
  • find a dataset that a colleague used of which they can’t remember the name,
  • find the top datasets that a team has used for collaborative purposes.

To fulfill their data scientists needs, Spotify focused first on their search experience.

They built a search ranking algorithm based on popularity. By doing so, data scientists reported that their search results were more relevant, and had more confidence in the datasets they discovered because they were able to see which dataset was more widely-used by the company.

In addition to improving their search rank, they introduced new types of properties (schemas, fields, contact, team, etc.) to Lexikon to better represent their data landscape.

These properties are able to open up new pathways for data discovery. In the example down below, a data scientist is searching for a “track_uri”. They are able to navigate through the “track_uri” schema field page and see the top tables containing this information. Since adding this new feature, it has proven to be a critical pathway for data discovery, with 44% of Lexikon users visiting these types of pages.

’

Final thoughts on Lexikon

Since making these improvements, the use of Lexikon amongst data scientists has increased from 75% to 95%, putting it in the top 5 tools used by data scientists!

Data discovery is thus, no longer a major pain point for their Spotifiers.

Sources:

Spotify Usage and Revenue Statistics (2019): https://www.businessofapps.com/data/spotify-statistics/
How We Improved Data Discovery for Data Scientists at Spotify: https://labs.spotify.com/2020/02/27/how-we-improved-data-discovery-for-data-scientists-at-spotify/
75 amazing Spotify Statistics and Facts (2020): https://expandedramblings.com/index.php/spotify-statistics/

Learn more about data discovery solutions in our white paper: “Data Discovery through the eyes of Tech Giants”

Discover the various data discovery solutions developed by large Tech companies, some belonging to the famous “Big Five” or “GAFAM”, and how they helped them become data-driven.

data-discovery-mockup-EN-no-shadow
download our white paper

Metadata through the eyes of Web Giants

Metadata through the eyes of Web Giants

by Zeenea Software | Mar 17, 2020 | Data Inspiration, Metadata Management

Data life cycle analysis is an element in data management that enterprises are still struggling to implement.

Organizations at the forefront of data innovation such as Uber, LinkedIn, Netflix, Airbnb and Lyft have also seen the value of metadata in the magnitude of this challenge.

They thus developed a metadata management strategy using dedicated platforms. Frequently developed on a custom basis, they facilitate data ingestion, indexing, search, annotation and discovery in order to maintain high quality datasets.

The following examples highlight a shared constant: the difficulty, increased by volume and variety, of transforming business data into exploitable knowledge.

Let’s take a look at the analysis and context of these Web giants:

Uber

Every interaction on Uber’s platform, from their ride sharing services to their food deliveries, is data-driven. Through analysis, their data enables more reliable and relevant user experiences.

Uber’s key stats

  • thousands of billions of Kafka messages a day,
  • hundreds of petabytes of data in HDFS in data centers,
  • millions of analytical queries weekly.

However, the volume of data generated alone is not sufficient to leverage the information it represents; to be used effectively and efficiently, data requires more context to make optimal business decisions.

To provide additional information, Uber therefore developed “Databook”, the company’s internal platform that collects and manages metadata on internal datasets in order to transform data into knowledge.

Databook is designed to enable Uber employees to effectively explore, discover and use Uber’s data. Databook gives context to their data (its meaning, quality, etc) and ensures that it is maintained in its platform for the thousands of employees who want to analyze the data. In short, Databook’s metadata enables data leaders to move from viewing raw data to actionable knowledge.

In the article Databook: Turning Big Data into Knowledge with Metadata at Uber, the article concludes that one of the biggest challenges for Databook was to move from manual metadata repository updates to automation.

Airbnb

At a conference in May 2017, John Bodley, Data Engineer at AirBnB, outlined new issues arising from the company’s growth: a confusing and non-unified landscape that wasn’t allowing access to increasingly important information.
What can we do with all this data collected on a daily basis? How do we turn them into assets for all Airbnb employees?

A dedicated team set out to develop a tool that would democratize access to data within the company. Their work was based both on the knowledge of the analysts and their ability to understand the critical points, and on that of the engineers, who were able to offer a more technical vision. At the heart of the project, interviews of employees concerning their issues were conducted.

What emerged from this survey was a difficulty in finding the information employees needed to work, and a still too tribal approach to sharing and holding information.

To meet these challenges, AirBnB created Data Portal, a metadata management platform. Data Portal centralizes and shares this information via this self-service platform.

Lyft

Lyft is a ride-sharing service and is Uber’s main competitor in the North American market.

The company found they were inefficiently providing data access for its analytical profiles. Its reflections focused on making data knowledge available to optimize its processes. In just a few months, their goal of creating an interface for researching data presented these two major challenges:

  • Productivity – Whether it’s to create a new model, instrument a new metric, or perform an ad hoc analysis, how can Lyft use this data in the most productive and efficient way possible?
  • Compliance – When collecting data about an organization’s users, how can Lyft comply with increasing regulatory requirements and maintain the trust of its users?

In their article Amundsen – Lyft’s data discovery & metadata engine, Lyft states that the key does not lie in the data, but in the metadata!

Netflix

As the world leader in video streaming, data exploitation at Netflix is, of course, a major strategic focus.

Given the diversity of their data sources, the video platform wanted to offer a way to federate and interact with these assets from a single tool. This search for a solution led to Metacat.

This tool acts as a layer of access to data and metadata from Netflix data sources. It allows its users to access data from any storage system through three different features:

  1. Adding business metadata: By hand or user-defined, business metadata can be added via Metacat.
  2. Data discovery: The tool publishes schema and business metadata defined by its users in Elasticsearch, facilitating full-text search of information in data sources.
  3. Data Change Notification and Auditing: Metacat records and notifies all changes to metadata from storage systems.

In their blog article, “Metacat: Making Big Data Discoverable and Meaningful”, at Netflix, the firm confirms that they are far from finished working on their solution!

There are a few more features they have yet to work on to improve the data warehousing experience:

  • Schema and metadata visioning to provide table history.
  • Provide contextual information on arrays for better data lineage.
  • Add support for datastores like Elasticsearch and Kafka.

Learn more about data discovery solutions in our white paper: “Data Discovery through the eyes of Tech Giants”

Discover the various data discovery solutions developed by large Tech companies, some belonging to the famous “Big Five” or “GAFAM”, and how they helped them become data-driven.

data-discovery-mockup-EN-no-shadow
download our white paper

Amundsen: How Lyft is able to easily discover their data

Amundsen: How Lyft is able to easily discover their data

by Zeenea Software | Feb 27, 2020 | Data Inspiration, Metadata Management

In our last article, we spoke of Uber’s Databook , an in-house platform designed by their very own engineers with the aim to turn data into contextualized assets. In this article, we will focus on Lyft’s very own data discovery and metadata platform: Amundsen.

In response to Uber’s success, the ride-sharing market saw a major wave of competitors arrive and among those, there is Lyft.

Lyft key figures & statistics

Founded in 2012 in San Francisco, Lyft operates in more than 300 cities across the United States and Canada. With over 29% of the US ride-sharing market*, Lyft has certainly secured the second position for itself, standing neck to neck with Uber. Some key statistics on Lyft include:

  • 23 million Lyft users as of January 2018,
  • More than a billion Lyft rides,
  • 1,4 million drivers (Dec. 2017).

And of course, those numbers have transformed into colossal amounts of data to manage! In a modern data-driven company such as Lyft, it is evident that their platform is powered by their data. With the rapid increase of the data landscape, it becomes increasingly difficult to know what data exists, how to access them and what information is available.

This problem led to the creation of Amundsen, Lyft’s open source data discovery solution and metadata platform.

Let’s get to know Amundsen

Named after the Norwegian explorer Roald Amundsen, Lyft improves their data users productivity by providing an intuitive search interface for data, that looks like this:

While Lyft’s data scientists wanted to spend the majority of the time on model development and production, they realized that most of their time was being spent on data discovery. They would find themselves asking questions such as:

  • Does this data exist? If it does, where can I find it? Can I access it?
  • Who / which team is the owner? Who are the common users?
  • Can I trust this data?

To answer these questions, Lyft was inspired by search engines like Google.

As shown above, their entry point is a simple search box where users can type any keyword such as “customers” “employees” or “price”. However, if the data user does not know what they are looking for, the platform presents the user with a list of the most popular tables, so they can browse through them freely.


Some key features:

The search results are shown in “list form” where the description about the table and the date when the table was last updated appears. The ranking used is similar to Google’s Page Rank, where the most popular and relevant tables show up in the first results.

When a data user at Lyft finds what they’re looking for and selects their choice, the user is directed to a detail page which shows the name of the table as well as its manually curated description. Users can also manually insert tags, the owners, and other descriptions. However, a lot of their metadata is automatically curated such as the table’s popularity or even its frequent users.

When in a table, users are able to explore the associated columns to further discover the table’s metadata.

For example, if you were to select the column “distance_travelled” as shown below, you will find a small definition of the field and its related stats such as the count record, the max count, min count, average count, etc, for data scientists to better understand the shape of their data.

Lastly, users can have access to view the data of the dataset by pressing the preview button of the page. Of course, this is only possible if the user has access to the underlying data in the first place.

How Amundsen democratizes data discovery

Showing the relevant data

Amundsen now empowers all employees at Lyft, from new employees to the most experienced, to become autonomous in their data discovery for their daily tasks.

Now let’s talk technical. Lyft’s data warehouse is on Hive and all physical partitions are stored in S3. Their data users rely on Presto, a live query engine, for their table’s discovery. In order for their search engine to show the most important or relevant tables for their users, Lyft uses the DataBuilder framework to build a query usage extractor that parses query logs to get table usage data. Then, they persist in this table usage as an Elasticsearch table document. And that’s how, in very short, they are able to retrieve the most relevant datasets for their data users.

Connecting data with people

As much as we like to claim how technical and digital we all are, processes for finding data consists mainly in interactions with people. And the notion of Data ownership is quite confusing; it is very time consuming unless you know exactly who to ask.

Amundsen addresses this issue by creating relationships between their users and their data thus, tribal knowledge is shared through exposing these relationships.

Lyft currently has three types of relationships between users and data: followed, owned and used. This information helps experienced employees become helpful resources for other employees with a similar job role. Amundsen also makes the tribal knowledge easier to find thanks to a link to each user profile on the internal employee directory.

They’ve also been working on implementing a notifications feature that would allow users to request more information from the data owners like for example, a missing description in a table.

If you’d like more information on Amundsen, please visit their website here.

What’s next for Lyft

Lyft is hoping to continue working with a growing community to enhance their data discovery experience and boost user productivity. Their roadmap currently includes email notifications system, data lineage, UI/UX redesign, and more!

The ride sharing company has not had its final word yet!

Sources:

Lyft – Statistics & Facts: https://www.statista.com/topics/4919/lyft/
Lyft And Its Drive Through To Success: https://www.startupstories.in/stories/lyft-and-its-drive-through-to-success
Lyft Revenue and Usage Statistics (2019): https://www.businessofapps.com/data/lyft-statistics/
Presto Infrastructure at Lyft: https://eng.lyft.com/presto-infrastructure-at-lyft-b10adb9db01?gi=f100fa852946
Open Sourcing Amundsen: A Data Discovery And Metadata Platform: https://eng.lyft.com/open-sourcing-amundsen-a-data-discovery-and-metadata-platform-2282bb436234
Amundsen — Lyft’s data discovery & metadata engine: https://eng.lyft.com/amundsen-lyfts-data-discovery-metadata-engine-62d27254fbb9

Learn more about data discovery solutions in our white paper: “Data Discovery through the eyes of Tech Giants”

Discover the various data discovery solutions developed by large Tech companies, some belonging to the famous “Big Five” or “GAFAM”, and how they helped them become data-driven.

data-discovery-mockup-EN-no-shadow
download our white paper

Databook: How Uber turns data into exploitable knowledge with metadata

Databook: How Uber turns data into exploitable knowledge with metadata

by Zeenea Software | Feb 17, 2020 | Data Inspiration, Metadata Management

databook

Uber is one of the most fascinating companies to emerge over the past decade. Founded in 2009, Uber grew to become one of the highest valued startup companies in the world! In fact, there is even a term for their success: “uberization” which refers to changing the market for a service by introducing a different way of buying or using it, especially using mobile technology.

From peer-to-peer ride services to restaurant orders, it is clear Uber’s platform is data driven. Data is the center of the Uber’s global marketplace, creating better user experiences across their services for their customers, as well as empowering their employees to be more efficient at their jobs.

However, Big Data by itself wasn’t enough; the amount of data generated at Uber requires context to make business decisions. So as many other unicorn companies did such as Airbnb with Data Portal, Uber’s Engineering team built Databook. This internal platform aims to scan, collect and aggregate metadata in order to see more clearly on the location of data in Uber’s IS and their referents. In short, a platform that wants to transform raw data into contextualized data.


How Uber’s business (and data) grew

Since 2016, Uber has added new lines of businesses to its platform including Uber Eats and Jump Bikes. Some statistics on Uber include: 

  • 15 million trips a day
  • Over 75 million active riders
  • 18,000 employees since its creation in 2009

As the firm grew, so did its data and metadata. To ensure that their data & analytics could keep up with their rapid pace of growth, they needed a more powerful system for discovering their relevant datasets. This led to the creation of Databook and its metadata curation.


The coming of Databook

The Databook platform manages rich metadata about Uber’s datasets and enables employees across the company to explore, discover, and efficiently use their data. The platform also ensures their data’s context isn’t lost among the hundreds of thousands of people trying to analyse it. All in all, Databook’s metadata empowers all engineers, data scientists and IT teams to go from just visualizing their data to turning it into exploitable knowledge


Databook enables employees to leverage automated metadata in order to collect a wide variety of frequently refreshed metadata. It provides a wide variety of metadata from Hive, MySQL, Cassandra and other internal storage systems.To make them accessible and searchable, Databook offers its consumers a user interface with a Google search engine or its RESTful API.


Databook’s architecture

Databook’s architecture is broken down into three parts: how the metadata is collected, stored, and how its data is surfaced.

Conceptually, the Databook architecture was designed to enable four key capabilities:

  • Extensibility: New metadata, storage, and entities are easy to add.
  • Accessibility: Services can access all metadata programmatically.
  • Scalability: Support business user needs and technology novelty
  • Power & speed of execution

To go further on Databook’s architecture, please read their article https://eng.uber.com/databook/

What’s next for Databook?

With Databook, metadata at Uber is now more useful than ever!

But they still hope to develop other functionalities such as the abilities to generate data insights with machine learning models and create advanced issue detection, prevention, and mitigation mechanisms.

Sources

  • Databook: Turning Big Data into Knowledge with Metadata at Uber: https://eng.uber.com/databook/
  • How LinkedIn, Uber, Lyft, Airbnb and Netflix are Solving Data Management and Discovery for Machine Learning Solutions: https://towardsdatascience.com/how-linkedin-uber-lyft-airbnb-and-netflix-are-solving-data-management-and-discovery-for-machine-9b79ee9184bb
  • The Story of Uber https://www.investopedia.com/articles/personal-finance/111015/story-uber.asp
  • The definition of uberization, Cambridge dictionary: https://dictionary.cambridge.org/dictionary/english/uberization

Learn more about data discovery solutions in our white paper: “Data Discovery through the eyes of Tech Giants”

Discover the various data discovery solutions developed by large Tech companies, some belonging to the famous “Big Five” or “GAFAM”, and how they helped them become data-driven.

data-discovery-mockup-EN-no-shadow
download our white paper

What is Data Fingerprinting and similarity detection?

What is Data Fingerprinting and similarity detection?

by Zeenea Software | Dec 3, 2019 | Data Inspiration

With the emergence of Big Data, enterprises found themselves with a colossal amount of data. In order to understand and analyse their data, as well as meet the various regulatory requirements, it is vital for organizations to document their data assets. However, documenting and giving context to thousands of datasets is a very difficult, even impossible, task to do by hand.

Or, you can use Data Fingerprinting!

What is Data Fingerprinting?

In the data domain, a fingerprint represents a “signature”, or fingerprint, of a data column. The goal here is to give context to these columns.

Via this technology, a Data Fingerprint can automatically detect similar datasets in your databases and can document them more easily, making data steward’s tasks less fastidious and more efficient. For example, supervised by the data steward, data fingerprinting technologies allow us to understand that a column of data with the information “France”, “United States”, and “Australia” represents “Countries”.

Data Fingerprinting at Zeenea

In Zeenea’s case, our metadata management platform’s objective is to give meaning and context to your catalogued datasets in the most automatic way as possible. With our Machine Learning technologies, Zeenea identifies dataset schema columns, analyses them and gives them their own “signature”. In this way, if any of these fingerprints are similar, our Data Catalog will make suggestions as to whether the Data Steward should give the same information relative to another.

This technology also gives a means for DPOs to, among others, underline and point out personal or sensitive information that the organization possesses in its databases.

Contact us

What is the difference between a data dictionary and a business glossary?

What is the difference between a data dictionary and a business glossary?

by Zeenea Software | Nov 18, 2019 | Data Catalog, Metadata Management, Zeenea Product


In metadata management, we often talk about data dictionaries and business glossaries. Although they might sound similar, they’re actually quite different! Let’s take a look at their differences and relations.

What is a data dictionary?

A data dictionary is a collection of descriptions of data objects or items in a data model.

These descriptions can include attributes, fields, or even properties on their data such as their types, transformations, relations, etc.

Data dictionaries help data explorers better understand their data and metadata. Usually in the form of tables or spreadsheets, data dictionaries are a must have IT knowledge for technical users such as developers, data analysts, data scientists, etc.


What is a business glossary?

While data dictionaries are useful to technical users, a business glossary is meant to bring meaning and context to data in all departments of the enterprise.

A business glossary is therefore a place where business and/or data terms are defined. It may sound simple, however, it is rare that all employees in an organization share a common understanding of even basic terms such as “contact” and “customer”.

Example of a business glossary:

The main differences between data dictionaries and business glossaries are:

Data dictionaries deal with database and system specifications, mostly used by IT teams. Business glossaries are more accessible and standardize definitions for everyone in the organization.

Data dictionaries usually come in the form of schemas, tables, columns, etc. whereas a business glossary provides a unique definition for business terms in textual form.

A business glossary cross references terms and their relationships whereas data dictionaries do not.

What is the relation between a data dictionary and a business glossary?

The answer is simple: a business glossary provides meaning to the data dictionary.

For example, a US social security number (SSN) will be defined as “a unique number assigned by the US government for the purpose of identifying individuals within the US Social Security System” in the business glossary. In the data dictionary, the term SSN is defined as “a nine character string typically displayed with hyphens”.

If a data citizen ever has a doubt on what the term “SSN” means in the context of their data dictionary, they can always search for the associated business term inside the business glossary.


Interested in automating a data dictionary and building a business glossary for your enterprise?

Create a central metadata repository for all corporate data sources with our data catalog thanks to our connectors and APIs.

Our tool also provides a user friendly and intuitive way to build and import your business glossaries in order to link these definitions with any Zeenea’s concepts.

Create a single source of truth in your enterprise!

Discover our Business Glossary

How does data visualization bring value to an organization?

How does data visualization bring value to an organization?

by Zeenea Software | Oct 1, 2019 | Data Inspiration

Data visualization definition

Data visualization is defined as a graphical representation of data. It is used to help people understand the context and significance of their information by showing patterns, trends and correlations that may be difficult to interpret in plain text form.

These visual representations can be in the form of graphs, pie charts, heat maps, sparklines, and much more.

What are the advantages of data visualization?

In BI, or Business Intelligence, data visualization is already a must have feature. With the emergence of Big Data, data visualization is becoming even more critical to help data citizens make sense of the millions of data being generated everyday. Not only does it help data citizens curate their data into an easy-to-understand visual representation, it also allows for employees to save time and work more efficiently.

In a way, data visualization also allows organizations to democratize data for everyone within an organization. With this, Data Leaders like Chief Data Officers see in this discipline a way to replace intuition decision-making with data analysis. Thus, be able to evangelize a data driven culture within their enterprises.

How can you get more value from modern data visualization platforms?

Most organizations that adopt data visualization tools struggle to visually represent their data in a way that maximizes data value. However, modern data visualization tools are expanding to include new use cases. These tools enable enterprises to find and communicate opportunities on important data analysis. Their strengths are:

Better communication and understanding of data

Data visualization allows employees, even those agnostic to data, to understand, analyse and communicate on data with new more interactive formats. This corporate will to become data-driven leads them to better inform and train their organizations to understand how to use data visualization tools and their relevant formats. These formats can be heat maps, bubble charts, tree maps, waterfall charts, etc.

More interactions on data analysis

Reporting data is becoming more collaborative in organizations and presenting data a daily activity. Thus, data visualization is becoming more “responsive” allowing it to adapt to any device and any place the data is being shared. These tools open up to web and mobile techniques to share data stories and explore data collaboratively. Moreover, it’s large-format screens that create a more general understanding of the data in management meetings, for instance.

Supporting data storytelling

Data storytelling is about communicating findings rather than monitor or analyze their progress. Companies such as Data Telling and Nugit specialize in this. With the use of infographics, data visualization platforms can support data storytelling techniques in communicating the meaning of the data to the management teams. These kinds of representations grab people’s attention and better help them recall the information later.

An automatic data visualization

Data users are increasingly expecting their analytic software to do more for them. Augmented data visualization is very useful, where people are not sure which visual format is best-suited for the dataset they want to explore or analyze. These automatic features are best made for citizen data scientists, whose time will be spent on analyzing data and finding new use-cases rather than visualizing them.


Gartner’s top Analytics & BI platforms

According to Gartner, the analytics and business intelligence platform leaders are:

microsoft bi

  • Microsoft: Power BI by Microsoft is a customizable data visualization toolset that gives you a complete view of your business. It allows employees to collaborate and share reports inside and outside their organization and spot trends as they happen. Click for more information.

tableau data visualization

  • Tableau: Tableau helps people transform data into actionable insights. They allow users to explore with limitless visual analytics, build dashboards, perform ad hoc analyses, and more. Find out more about Tableau.

qlik data visualisation


  • Qlik: With Qlik, users are able to create smart visualizations, and drag and drop to build rich analytics apps acceleratedby suggestions and automation from AI. Read more about Qlik.

thoughtspot data visualization

  • ThoughtSpot: ThoughtSpot allows user to get granular insights from billions of rows of data.With AI technology, uncover insights from questions you might not have thought to ask. Click for more information on ThoughtSpot

In conclusion: why should enterprises use data visualization?

The main reasons that data visualization is important to enterprises, among others, are:

  • Data is easier to understand and remember
  • Visualizing data trends and relationships is quicker
  • Users are able to discovery data that they couldn’t have seen before
  • Data leaders can make better, data-driven decisions

Data Revolutions: Towards a Business Vision of Data

Data Revolutions: Towards a Business Vision of Data

by Zeenea Software | Aug 19, 2019 | Data Catalog

The use of massive data by the internet giants in the 2000s was a wake-up call for enterprises: Big Data is a lever for growth and competitiveness that encourages innovation. Today, enterprises are re-organizing themselves around their data in order to adopt a “data-driven” approach. It’s a story constituting several twists and turns that tends to finally find a solution.

This article discusses the different enterprise data revolutions undertaken in recent years up to now, in an attempt to maximize the business value of data.

Siloed architectures

In the 80s, Information Systems developed immensely. Business applications were created, advanced programming language emerged, and relational databases appeared. All these applications stayed on their owners’ platforms, isolated from the rest of the IT ecosystem. 

For these historical and technological reasons, an enterprise’s internal data were distributed in various technologies and in heterogeneous formats. In addition to organizational problems, we then speak of a tribal effect. Each IT department have their own tools and implicitly,  manage their own data for their own uses. We are witnessing a type of data hoarding within organizations. To back these suggestions, we frequently recall Conway’s law: “All architecture reflects the organization that created it.” Thus, this organization, called silos, makes for very complex and onerous cross-referencing of data originating from two different systems. 

The search for a centralized and comprehensive vision of an enterprise’s data will lead Information Systems to a new revolution. 

The concept of a Data Warehouse

By the end of the 90s, Business Intelligence was in full swing. For analytical purposes and with the goal of responding to all strategic questions, the concept of a data warehouse appeared. 

To make this, we will recover the data from mainframes or relational databases and transfer them to an ETL (Extract Transform Loader). Projected in a so-called pivot format, analysts and decision-makers can access data collected and formatted to answer pre-established questions and specific cases of reflection. From the question, we get a data model!

This revolution always comes with some problems…Using ETL tools has a certain cost, not to mention the hardware that comes with it. The elapsed time between the formalization of the need and the receipt of the report is time-consuming. It’s a revolution that is costly for perfectible efficiency.

The new revolution of a data lake…

The arrival of data lakes reverses the previous reasoning.  A data lake enables organizations to centralize all useful data storages, regardless of their source or format, for a very low cost. . We stock an enterprise’s data without presuming their usage in the treatment of a future use case. It is only according to a specific use where we will select these raw data and transform them into strategic information. 

We are moving from an “a priori” to an “a posteriori” logic. This revolution of a data lake focuses on new skills and knowledge: data scientists and data engineers are capable of launching the treatment of data, producing results much faster than the time spent using data warehouses. 

Another advantage of this Promised Land is its’ price. Often offered in an open-source way, data lakes are cheap, including the hardware that comes with them. We often speak of community hardware. 

… or rather a data swamp

Certain advantages are present with the data lake revolution but come along with new challenges. The expertise needed to instantiate and to maintain these data lakes are rare and thus, are costly for enterprises. Additionally, pouring data in a data lake day after day without efficient management or organization brings on the serious risk of rendering the infrastructure unusable. Data are then inevitably lost in the mass.

This data management is accompanied by new issues related to data regulation (GDPR, Cnil, etc.) and data security: already existing topics in the data warehouse world. Finding the right data for the right use is not yet an easy thing to do.

The settlement: constructing Data Governance

The internet giants understood that centralizing these data is the first step, however insufficient. The last brick necessary to go towards a “data-driven” approach is to construct data governance. Innovating through data requires greater knowledge of these data. Where are my data stored? Who uses them? With which goal in mind? How are they being used? 

To help data professionals chart and visualize the data life cycle, new tools have appeared: we call them, “Data Catalogs.” Located above data infrastructures, they allow you to create a searchable metadata directory. They make it possible to acquire a business vision and data techniques by centralizing all collected information. In the same way that Google doesn’t store web pages but rather, their metadata to reference them, companies must also store their data’s metadata in order to facilitate the exploitation of and discovery of them. Gartner confirms this in their study, “Data Catalog is the New Black”: if your data lake’s data is without metadata management and governance, it will be considered inefficient. 

Thanks to these new tools, data becomes an asset for all employees. The easy-to-use interface doesn’t require technical skills, becoming a simple way to know, organize, and manage these data. The data catalog becomes the reference collaborative tool in the enterprise. 

Acquiring an all-round view of these data and to start data governance to drive ideations thus becomes possible.  

Google Goods: The management and data democratization tool of Google

Google Goods: The management and data democratization tool of Google

by Zeenea Software | Apr 10, 2019 | Data Inspiration

When you’re called Google, the data issue is more than just central. A colossal amount of information is generated every day throughout the world, by all teams in this American empire. Google Goods, a centralized data catalog, was implemented to cross-reference, prioritize, and unify data.

This article is a part of a series dedicated to data-driven enterprises. We highlight successful examples of democratization and mastery of data within inspiring companies. You can find the Airbnb example here. These trailblazing enterprises demonstrate Zeenea’s ambition and it’s data catalog: to help organizations better understand and use their data assets.

Google in a few figures

The most-used search engine on the planet doesn’t need any introduction. But what is behind this familiar interface? What does Google represent in terms of market share, infrastructure, employees, and global presence?

In 2018, Google had [1]:

  • l90.6% market share worldwide
  • 30 million indexed sites
  • 500 million new requests every day

In terms of infrastructure and employment, Google represented in 2017 [2]:

  • 70,053 employees
  • 21 offices in 11 countries
  • 2 million computers in 60 datacenters
  • 850 terabytes to cache all indexed pages

Given such a large scale, the amount of data generated is inevitably huge. Faced with the constant redundancy of data and the need for precision for its usage, Google implemented Google Goods, a data catalog working behind the scenes to organize and facilitate data comprehension.

The insights that led to Google Goods

Google possesses more than 26 billion internal data [3]. And this includes only the data accessible to all the company employees.

Taking into account sensitive data that uses secure access, the number could double. This amount of data was bound to generate problems and questions, which Google listed as a reason for designing its tool:

An enormous data scale

Considering the figure previously mentioned, Google was faced with a problem that couldn’t be ignored. The sheer quantity and size of data made it impossible to process all them all. It was hence essential to determine which ones are useful and which ones aren’t.

The system already excludes certain information deemed unnecessary and is successful in identifying some redundancies. Therefore, it’s possible to create unique access roads through data without it being stored in different places within the catalog.

Data variety

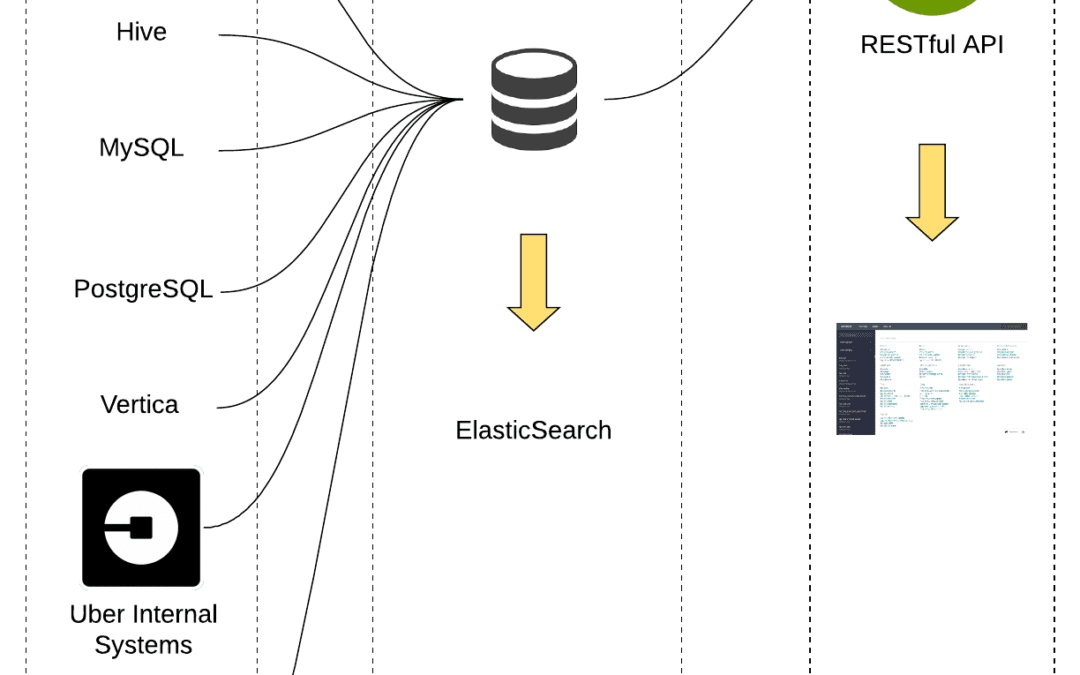
Data sets are stocked in a number of formats and in very different storage systems. This makes it difficult to unify data. For Goods, it is a real challenge with a crucial objective: to provide a consistent way to query and access information without revealing the infrastructure’s complexity.

Data relevance

Google estimates that 1 million data are both created and erased on a daily basis. This emphasizes the need to prioritize data and establish their relevance. Some are crucial in processing chains but only have value for a few days, others have a scheduled end of life that can last from several weeks to a few hours.

The uncertain nature of metadata

Many of the data cataloged are from different protocols, making metadata certification complex.  Goods therefore proceeds by trial and error to create hypotheses. This is due to the fact that it operates on a post hoc basis. In other words, collaborators don’t have to change the way they work. They are not asked to combine data sets with metadata when they are created. It is up to Goods to work, collect, and analyze data to bring them together and clarify them for future use.

A priority scale

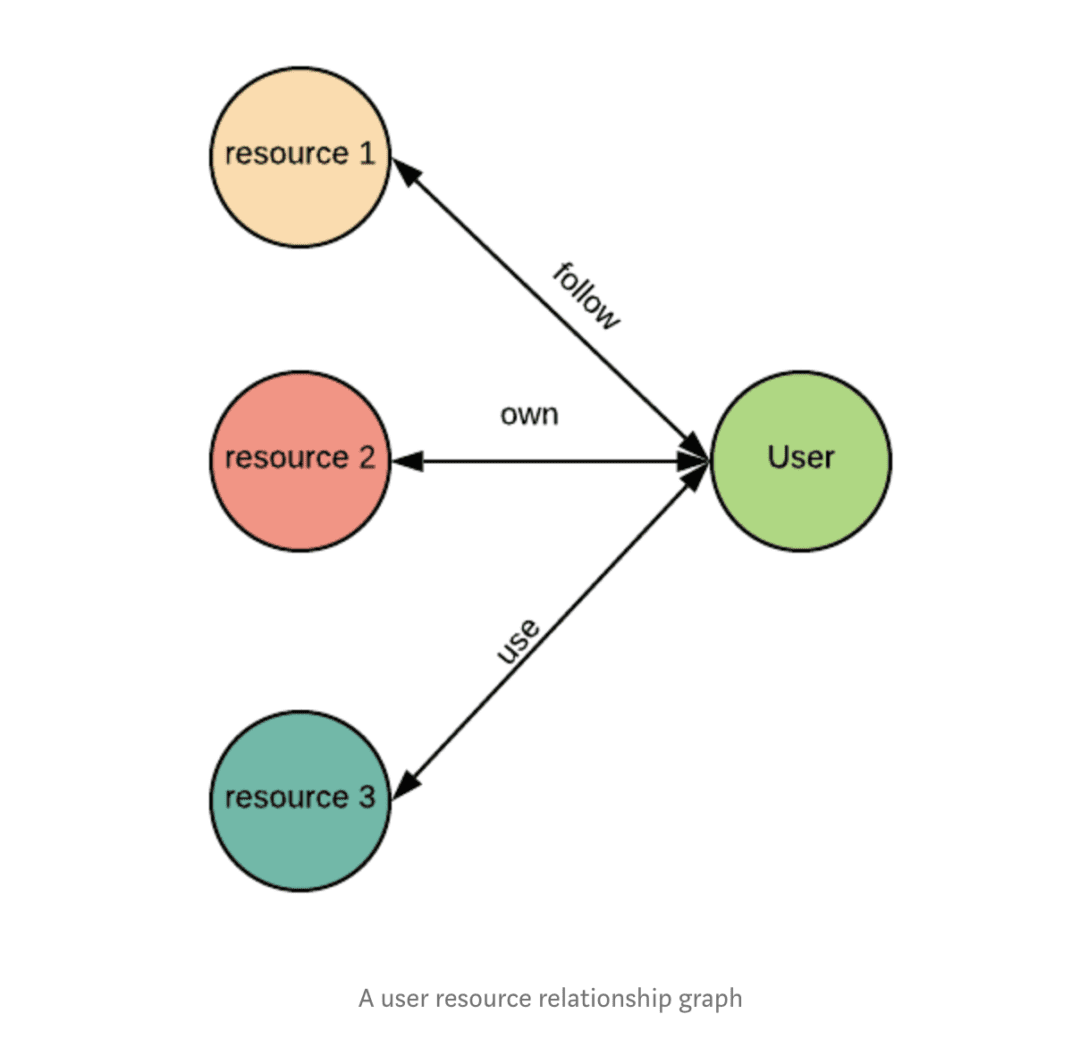
After working on discovery and cataloging, the question of prioritization arises. The challenge is the ability to respond to this question: “What makes a data important?” Providing an answer to this question is much less simple for an enterprise’s data than prioritizing web research, for example. In an attempt to establish a relevant ranking, Goods is based on the interactions between data, metadata, and other criteria. For instance, the tool considers that data is more important if its author has associated a description to go with it, or if several teams consult, use or annotate it.

Semantic data analysis

Carrying out this analysis allows, in particular, to better classify and describe the data in the search tool. It can thus respond to the correct requested information in the catalog. The example is given in the Google Goods reference article [3]: Suppose the schema of a data set is known and certain fields of the schema take on integer values. Thanks to inference on the data set’s content, the user can identify that these integer values are IDs of known geographical landmarks and then use this type of content semantics to improve geographical data research in the tool.

Google Goods features

Google Goods catalogs and analyzes the data to present it in a unified manner. The tool collects the basic metadata and tries to enrich them by analyzing a number of parameters. By repeatedly revisiting data and metadata, Goods is able to enrich itself and evolve.

The main functions offered to users are:
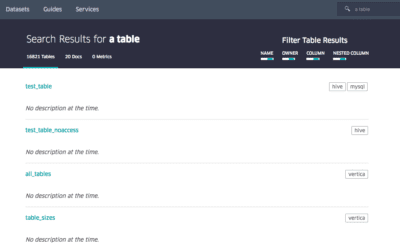
A search engine

Like the Google we know, Goods offers a keyword search engine to query a dataset. This is the moment when the challenge of data prioritization is taking place. The search engine offers data classified according to different criteria such as the number of processing chains involved, the presence, or the absence of a description, etc.

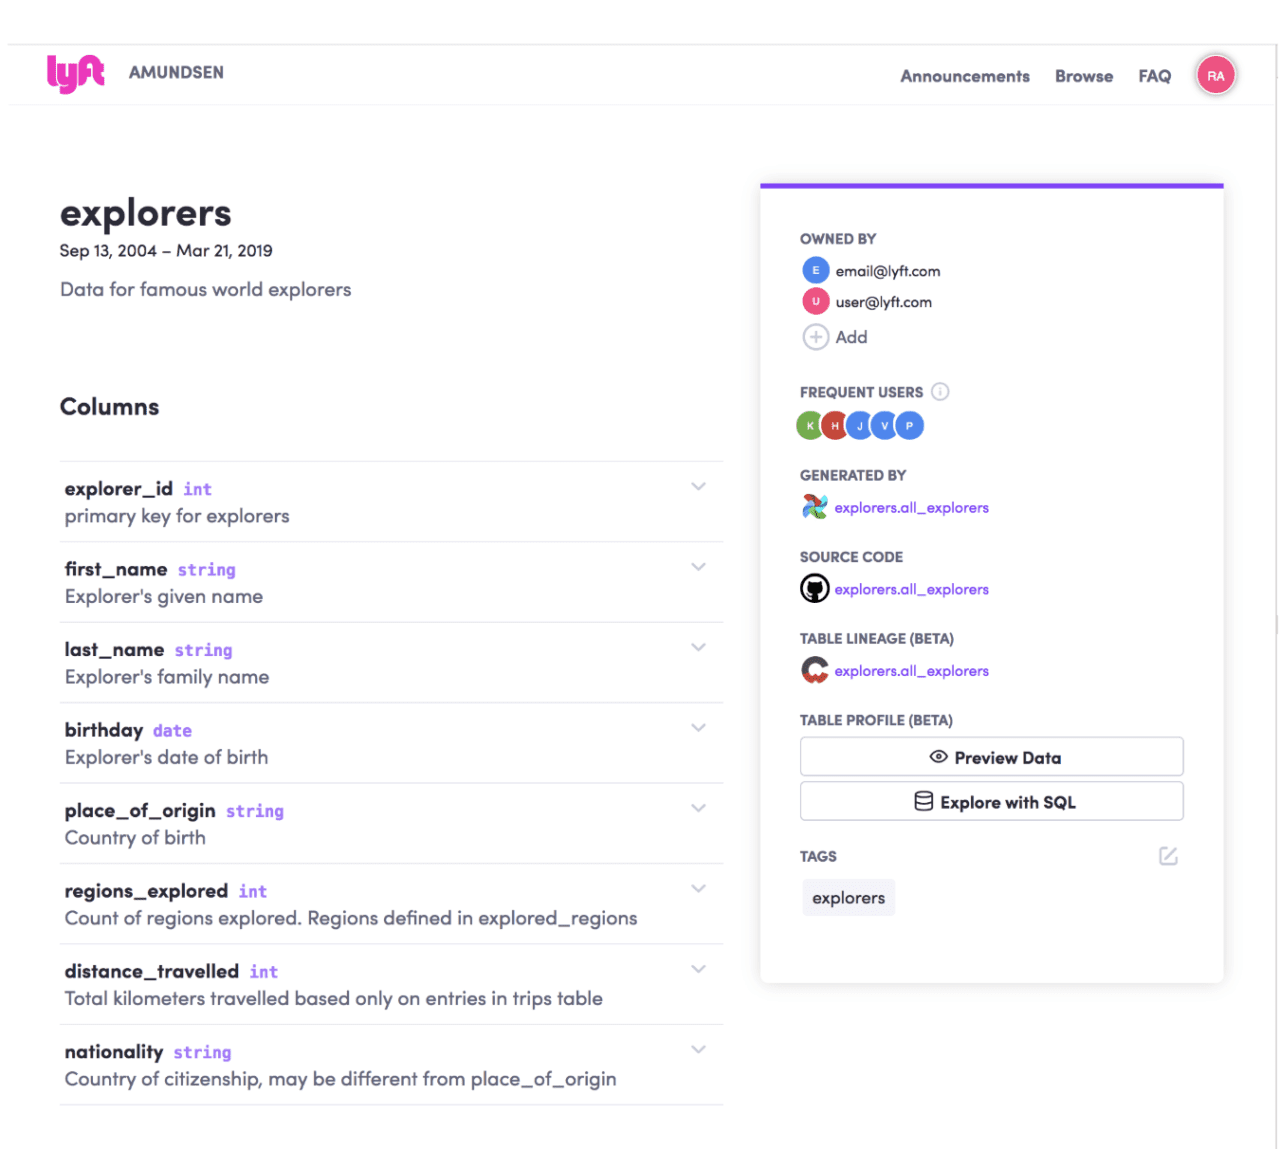
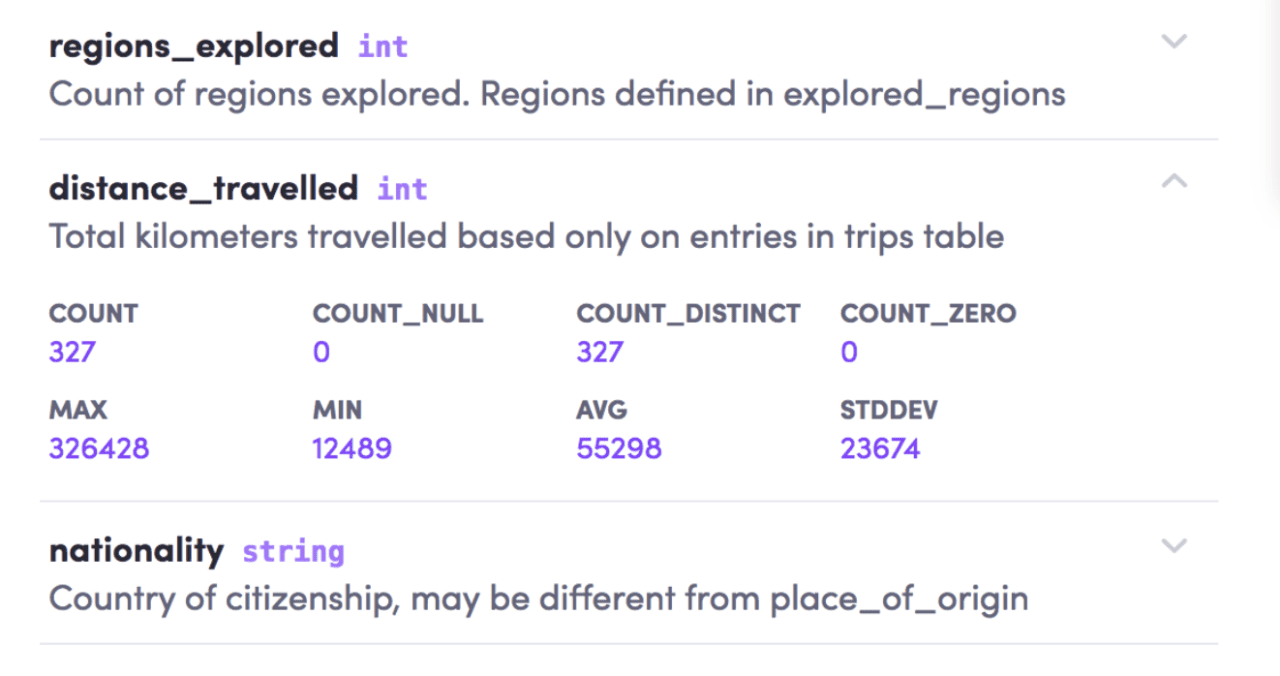
Data presentation page

Each data has at its disposal a page containing as much information as possible. In consideration that certain data can be linked to thousands of others, Google compresses data upstream recognized as most crucial to make them more comprehensible on a presentation page. If the compressed version remains too large, the information presented keeps only the more recent entries.

Team boards

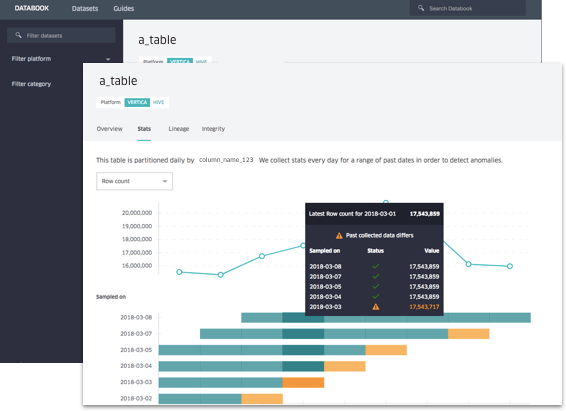
Goods created boards to distribute all data generated by a team. For example, this makes it possible to obtain different metrics and to connect with other boards. The board is updated each time Goods adds metadata. The board can be easily integrated into different documents so that teams can then share it.

In addition, it is also possible to implement monitoring actions and alerts on certain data. Goods is in charge of the verifications and can notify the teams in case of an alert.

Goods usage by Google employees

Over time, Google’s teams have come to realize the use of its tool as well its scope was not necessarily what the company expected.

Google was thus able to determine that employees’ principal uses and favorite features of Goods were:

Audit protocol buffers

Protocol Buffers are serialization formats with an interface description language developed by Google. It is widely used at Google for storing and exchanging all kinds of information structures.

Certain processes contain personal information and are a part of specific privacy policies. The audit of these protocols makes it possible to alert the owners of these data in the event of a breach of confidentiality.

Data recuperation

Engineers are required to generate a lot of data in the framework of their tests and often forget their location when they need to access it again. Thanks to the search engine, they can easily find them.

Understanding legacy code

It isn’t easy to find up-to-date information on the code or data sets. Goods manages the graphics that engineers can use to track previous code executions as well as the input and output of data sets and find the logic that links them.

Utilization of the annotation system

The bookmark system of data pages is fully integrated to find important information quickly and to easily share them.

Use of page markers

It’s possible to annotate data and attribute different degrees of confidentiality to them. This is so that others at Google can better understand the data they have in front of them.

With Goods, Google achieves prioritizing and unifying data access for all their teams. The system is meant to be non-intrusive and therefore operates continuously and invisibly for users in order to provide them with organized and explicit data. Thanks to this, the company improves team performance, avoiding redundancy. It saves on resources and accelerates access to data essential to the company’s growth and development.

[1] Moderator’s blog: https://www.blogdumoderateur.com/chiffres-google/
[2] Web Rank Info: https://www.webrankinfo.com/dossiers/google/chiffres-cles
[3] https://static.googleusercontent.com/media/research.google.com/fr//pubs/archive/45390.pdf

Learn more about data discovery solutions in our white paper: “Data Discovery through the eyes of Tech Giants”

Discover the various data discovery solutions developed by large Tech companies, some belonging to the famous “Big Five” or “GAFAM”, and how they helped them become data-driven.

data-discovery-mockup-EN-no-shadow
download our white paper

Metacat: Netflix makes their Big Data accessible and useful

Metacat: Netflix makes their Big Data accessible and useful

by Zeenea Software | Mar 29, 2019 | Data Inspiration

Like many numerous companies, Netflix has a colossal amount of data that come from many different data sources in various formats. As the leading streaming video on demand company (SVOD), data exploitation is, of course, a major strategic asset. Given the diversity of its data sources, the streaming platform wanted a way to federate and interact with these assets using a single tool. This led to the creation of Metacat.

This article explains the motivations behind the creation of Metacat, a metadata solution intended to facilitate the discovery, treatment, and management of Netflix’s data.

Read our previous articles on Google and AirBnB.


Netflix’s key figures

Netflix has come a long way since its DVD rental company in the 1990s. Video consumption on Netflix accounts for 15% of global internet traffic. But Netflix today is also:


  • 130 million paying subscribers worldwide (400% increase since 2011)
  • $10 billion turnover, including $403 million in profits
  • $100 billion market capitalizations, or the sum of all the leading television groups in Europe
  • $6 billion investment in original creations (TV shows and movies).

Netflix is also a data warehouse of 60 petabytes (60 million billion bytes), which is a real challenge for the firm to exploit and federate these data.


Netflix’s Big Data platform architecture


netflix metacat architecture

Its basic architecture includes three key services. These are the Execution Service (Genie), the Metadata Service (Metacat), and the Event Service (Microbot).


data sources netflix metacat

In order to operate between its different languages and data sources, which are not very compatible with each other, Metacat was born. This tool acts as a data and metadata access layer from Netflix’s data sources. A centralized service accessible by any data user in order to facilitate their discovery, treatment, and management.


Metacat & its features

Netflix has data queries, such as Hive, Pig, or Spark, that are not operable together. By introducing a common abstraction layer, Netflix can provide data access to its users, regardless of their storage systems.

In addition, Metacat goes so far as to simplify transferring one dataset to a datastore to another.


Business metadata

Hand-written, user-defined, business-oriented metadata, in free format can be added via Metacat. Its main information includes the connections, configurations, metrics, and the life cycles of each dataset. 

Data discovery

By creating Metacat, Netflix makes it easy for consumers to find business datasets. The tool publishes schema and business metadata defined by its users in Elasticsearch, making it easier to find full-text information in its data sources.

Data modification and audit

As a cross-functional tool for all data stores, Metacat registers and notifies all changes made to the metadata and the data itself from its storage systems.


Metacat and the future of Netflix

According to Netflix, the current version of Metacat is a step towards the new features they are working on. They still want to improve the visualization of their metadata, as it would be very useful for restoration purposes.

Metacat, according to Netflix, should also be able to have a plug-in architecture. Thus, their tool could validate and maintain all of its metadata. This is because users define metadata in free form. Therefore, Netflix needs to put into place a validation process that can be done before storing the metadata.

As a centralizing tool for multi-source and multi-format data, Netflix’s Metacat has clearly made progress.

The development of this in-house service has adapted to all the tools used by the company, allowing Netflix to become Data Driven.


Sources

  • Metacat: Making Big Data Discoverable and Meaningful at Netflix https://netflixtechblog.com/metacat-making-big-data-discoverable-and-meaningful-at-netflix-56fb36a53520
  • La folie Netflix en cinq chiffres https://www.lesechos.fr/tech-medias/medias/la-folie-netflix-en-cinq-chiffres-1132022


Learn more about data discovery solutions in our white paper: “Data Discovery through the eyes of Tech Giants”

Discover the various data discovery solutions developed by large Tech companies, some belonging to the famous “Big Five” or “GAFAM”, and how they helped them become data-driven.

data-discovery-mockup-EN-no-shadow
download our white paper

Data portal, the data centric tool of AirBnB

Data portal, the data centric tool of AirBnB

by Zeenea Software | Feb 18, 2019 | Data Inspiration, Metadata Management

AirBnB is a burgeoning enterprise. To keep pace with their rapid expansion, AirBnB needed to really think about data and the extension of its’ operation. The Data Portal was born from this growing momentum, a fully Data-Centric tool at the disposal of employees.

This article is the first of a series dedicated to Data-Centric enterprises. We will shed light on successful examples of the democratization and the mastery of data within inspiring organizations. These pioneering enterprises demonstrate the ambition of Zeenea’s data catalog: to help each structure to better understand use their data assets.

Airbnb today:

In a few years, AirBnB has secured their position as a leader of the collaborative economy around the world. Today they are among the top hoteliers on the planet. In numbers [1], they represent:

  • 3 million recorded homes,
  • 65,000 registered cities,
  • 190 countries with AirBnB offers,
  • 150 million users.

France is its’ second largest market behind the United States. It alone counts for more than 300,000 homes.

The reflections that led to the Data Portal

During a conference held in May 2017, John Bodley, a data engineer at AirBnB, outlined new issues arising from the high growth of collaborators (more than 3,500) and the massive increase in the amount of data, from both users as well as employees (more than 200,000 tables in their Data Warehouse). This is a confusing and divided landscape that doesn’t always allow access to increasingly important information.

How to combine success with a very real management problem with data? What to do with all this information collected daily and this knowledge both at the user and collaborator level? How can they be transformed into a force for all airbnb employees?

Here are the questions asked that led to the creation of the data portal.

Beyond these challenges, a problem of overall vision has been imposed on the company.

Since its creation in 2008, AirBnB has always paid great attention to their data and their operations. This is why a dedicated team has positioned themselves for the battle to develop a tool that democratizes data access within the enterprise. Their work is simultaneously founded on analysts’ knowledge and their ability to understand the critical points as well as on their engineers who also offer a more concrete vision of the whole. At the heart of the project, an in-depth survey of employees and of their problems were conducted.

From this survey, one constant emerged: a difficulty of finding information, which the collaborators need in order to work. The presence of tribal knowledge, kept by a certain group of people, is both counter-productive and unreliable.

The result: The necessity of raising questions to colleagues, the lack of trust in the information (data’s validity, impossible to know if the data is up-to-date) and consequently, the creation of new, but duplicate data, which astronomically increases the already existing quantity.

To respond to these challenges, AirBnB created the Data Portal and released it to the public in 2017.

Data Portal, Airbnb’s data catalog

To give you a clear picture, the Data Portal could be defined as a cross between a search engine and a social network.

It was designed to centralize absolutely all incoming data, whether they come from employees or users, by the enterprise. The goal of the Data Portal is to be able to return this information, in graphic form, to whichever employee needs it.

This self-service system allows collaborators to access necessary information by themselves for the development of their projects. Beyond data itself, the Data Portal lets you obtain contextualized metadata. The information is provided with a background that allows you to valorize the data better and to understand it as a whole.

The Data Portal was designed in a collaborative approach.

With this in mind, it helps you to visualize within data all the interactions between the different collaborators of the enterprise. Thus, it is possible to know who is connected to which data.

The Data Portal and a few of its features

The Data Portal offers different features to access data in a simple and fun way, offering the user an optimal experience. You can see pages dedicated to each data set or a significant amount of metadata linked to it.


  • Research: Chris Williams, an engineer and a member of the team in charge of developing the tool, speaks of a “Google-esque” feature. The search page allows you to quickly access data, to graphics, and also to the people, groups, or relevant teams behind the data.
  • Collaboration: All in one sharing approach and implementing a collaborative tool, data can be added to a user’s favorites, pinned on a team’s board, or shared via an external link. Just like a social network, each employee also has a profile page. As the tool is accessible to all collaborators and intended to be completely transparent, it also includes all the members in the hierarchy. Former employees continue to have a profile with all created and used data. Always in a logic of information decompartmentalization and doing away with tribal knowledge.

  • Lineage: It is also possible to explore data’s hierarchy by viewing both parent and child data.

  • Groups: Teams spend a lot of time exchanging around the same data. To enable each to share information more quickly and more easily, the possibility to create working groups was implemented in the Data Portal. Thanks to these pages, a team’s members can organize their data, easily access them, and encourage sharing.

Within the tool


Democratizing data has several virtues. First off, this avoids creating dependence on information. An umbrella system weakens the enterprise’s equilibrium. If the information and the understanding of data are only held by one group of people, the dependency ratio becomes too high.

In addition, it is important to simplify the understanding of data so that the collaborators can operate them better.

Globally speaking, the challenge for AirBnB is also to improve the trust in data for all their collaborators. So that each can be assured they are working with the correct information, updated, etc.

AirBnB is no fool and the team behind the Data Portal knows that the handling of this tool and its wise utilization will take time. Chris Williams put it this way: “Even if asking a colleague for information is easy, it is totally counterproductive on a larger scale.”

To change these habits, take the first step to consult the portal rather than directly exchanging will require a little effort from collaborators.

The vision of the Data Portal over time

To promote trust in the supplied data, the team wants to create a system of data certification. It would make it possible to certify both the data and the person who initiated the certification. Certified content will be highlighted in the search results.

Over time, AirBnB hopes to develop this tool at different levels:

  • Analysis of the network in order to identify obsolete data.

  • Create alerts and recommendations. Always with an explorative approach, the tool could possibly become more intuitive suggesting new content or updates on data accessed by a user.

  • Making data pleasant. To create an appealing setting for the employees by presenting, by example, the most viewed chart of the month, etc.

With the Data Portal, AirBnB pushes the use of data to the highest level.

The democratization of all employees makes it possible to make them more autonomous and efficient in their work and also reconstructs the enterprise’s hierarchy. And with more transparency, it will also become less dependent. The collaborative takes precedence over the notion of dedicated services. And the use of data reinforces enterprises’ strategy for their future development. A logical approach that it is a part of and is promoted among their customers.

Sources

[1] https://www.usine-digitale.fr/article/le-succes-insolent-d-airbnb-en-5-chiffres-cles.N512814
[2] Slides issues de la conférence « Democratizing Data at AirBnB » du 11 mai 2017 : https://www.slideshare.net/neo4j/graphconnect-europe-2017-democratizing-data-at-airbnb
https://medium.com/airbnb-engineering/democratizing-data-at-airbnb-852d76c51770

Democratizing Data at Airbnb from Neo4j

https://searchcio.techtarget.com/feature/Airbnb-capitalizes-on-nearly-decade-long-push-to-democratize-data

Learn more about data discovery solutions in our white paper: “Data Discovery through the eyes of Tech Giants”

Discover the various data discovery solutions developed by large Tech companies, some belonging to the famous “Big Five” or “GAFAM”, and how they helped them become data-driven.

data-discovery-mockup-EN-no-shadow
download our white paper

Recent Posts

  • HCLSoftware Completes Acquisition of Metadata Management Software Provider Zeenea
  • Harnessing the Power of AI in Data Cataloging
  • Key takeaways from the Zeenea Exchange 2024: Data Mesh and the decentralization of data management
  • The Role of Data Catalogs in Accelerating AI Initiatives
  • [SERIES] Data Shopping Part 2 – The Zeenea Data Shopping Experience

Categories

  • Data Catalog
  • Data Compliance
  • Data governance
  • Data Inspiration
  • Data Mesh
  • Data quality
  • Metadata Management
  • News & events
  • Zeenea Product