Optimize data discovery via a 360° view of your data landscape
-
Feature Note
One of our core values at Zeenea is simplicity. We strongly believe that data discovery should be quick and easy to accelerate data-driven initiatives across the entire organization. For this reason, we designed our platform to be intuitive and user-friendly, allowing you to search, explore, and identify the right data for your use cases in seconds. One of those design choices was the View 360 module.
In both Zeenea Studio and Explorer, users can access an automatically generated relations graph to facilitate the visibility and understanding of your enterprise data landscape. In this feature note, discover all the possibilities our View 360 can offer!
Powered by knowledge graph technologies
A knowledge graph is a data structure that represents a universe of knowledge: a collection of interlinked concepts, entities, relationships, and events. By collecting your information from your various sources, Zeenea automatically identifies, classifies, and tracks data based on the semantic attributes of your metadata. Our solution then maps your assets to key concepts to make them discoverable and accessible for your use cases.
Therefore, in both of our applications, data leaders can quickly and simply browse through their assets and their different relations – for preconfigured Item Types, Glossary Items, as well as your organization’s Custom Items in the “View 360” tab of their Item’s detailed page.
Easily navigate through your diagram
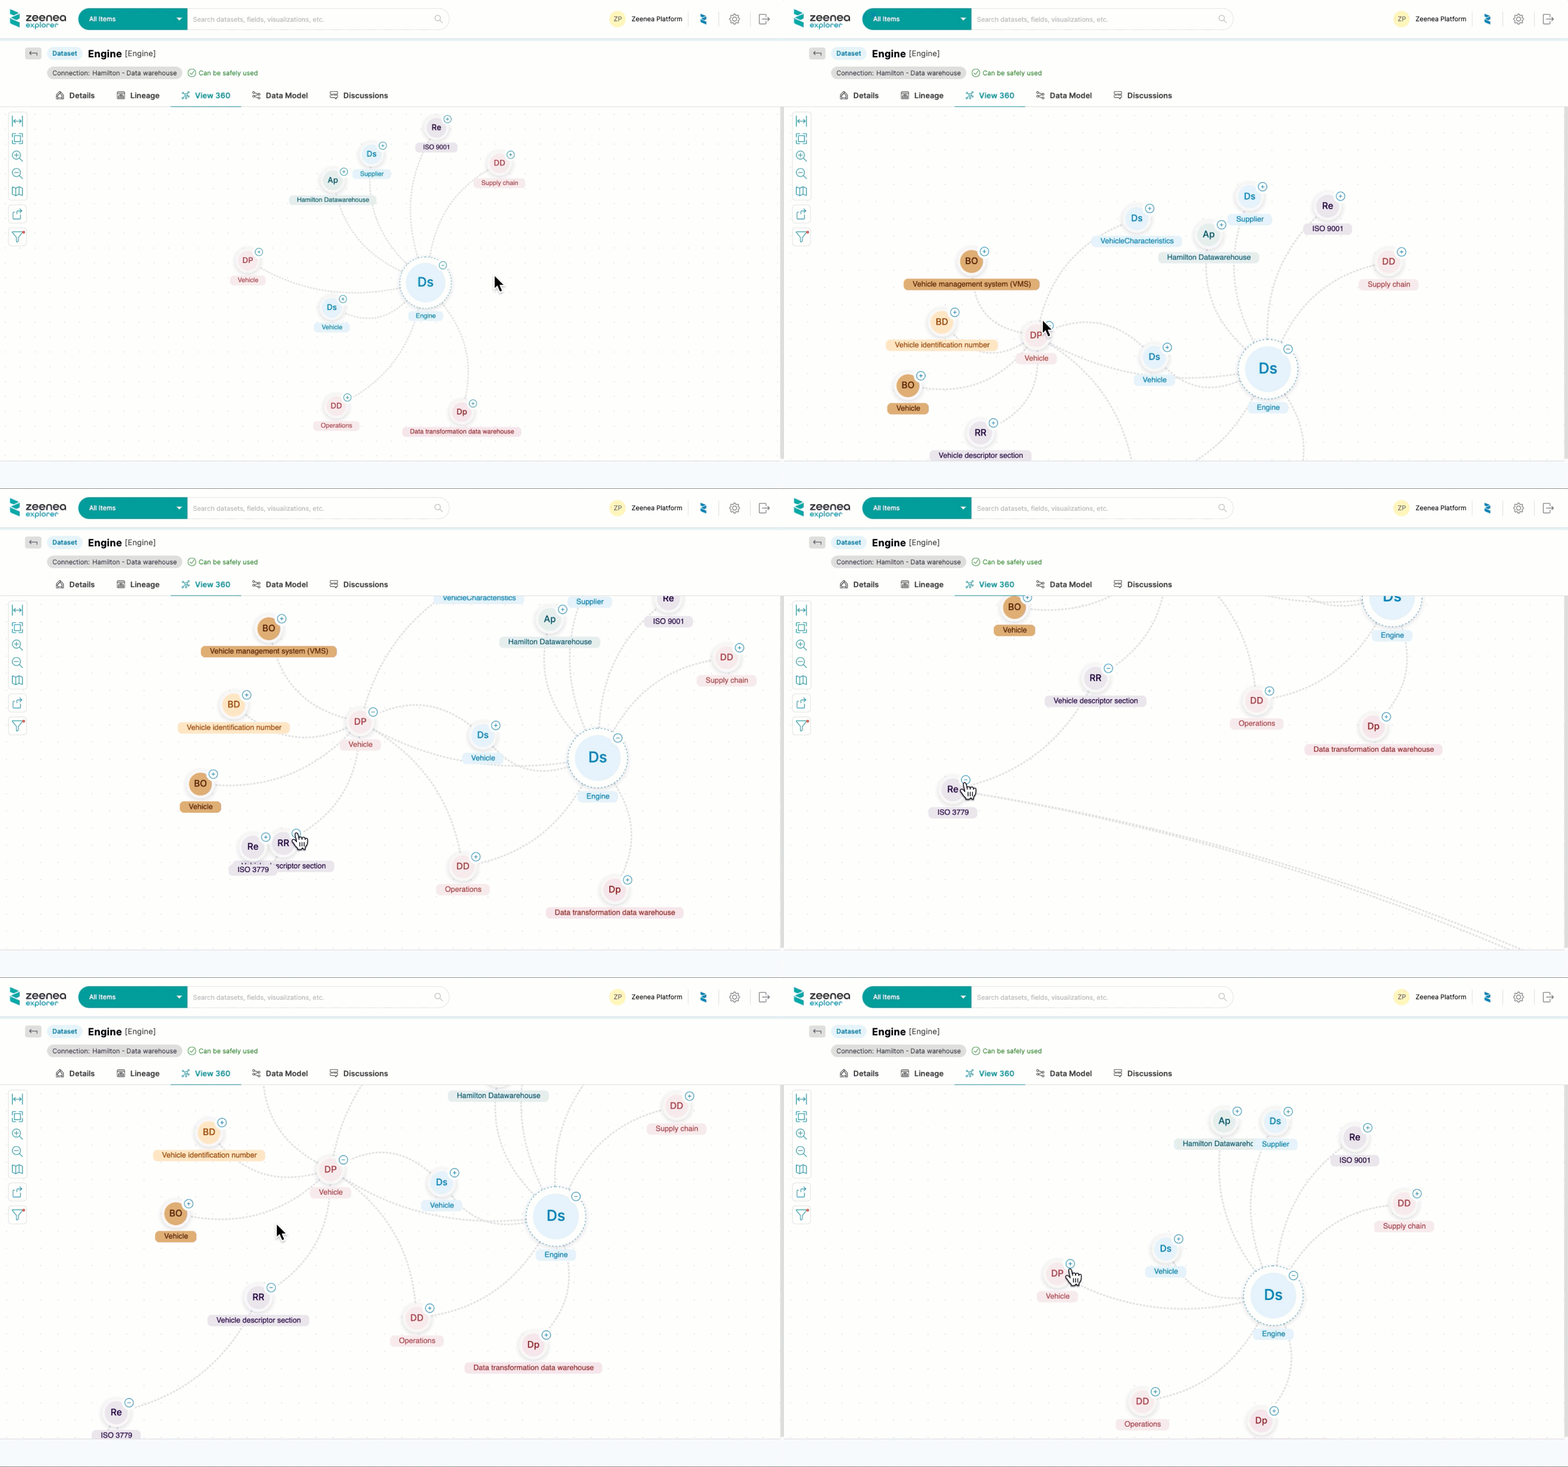
Our View 360 module was designed for anyone to easily explore and discover the relations between their organization’s data assets. By default, Zeenea displays the direct relation to an Item – for assets that have hundreds and thousands of relations between various Item Types, it would be overwhelming to display all of them on the graph – and excludes the related Fields. You can display the fields by using the filter on the left-hand side of the diagram.
However, if you wish to go further and display more relations, you can click on the “+” button.
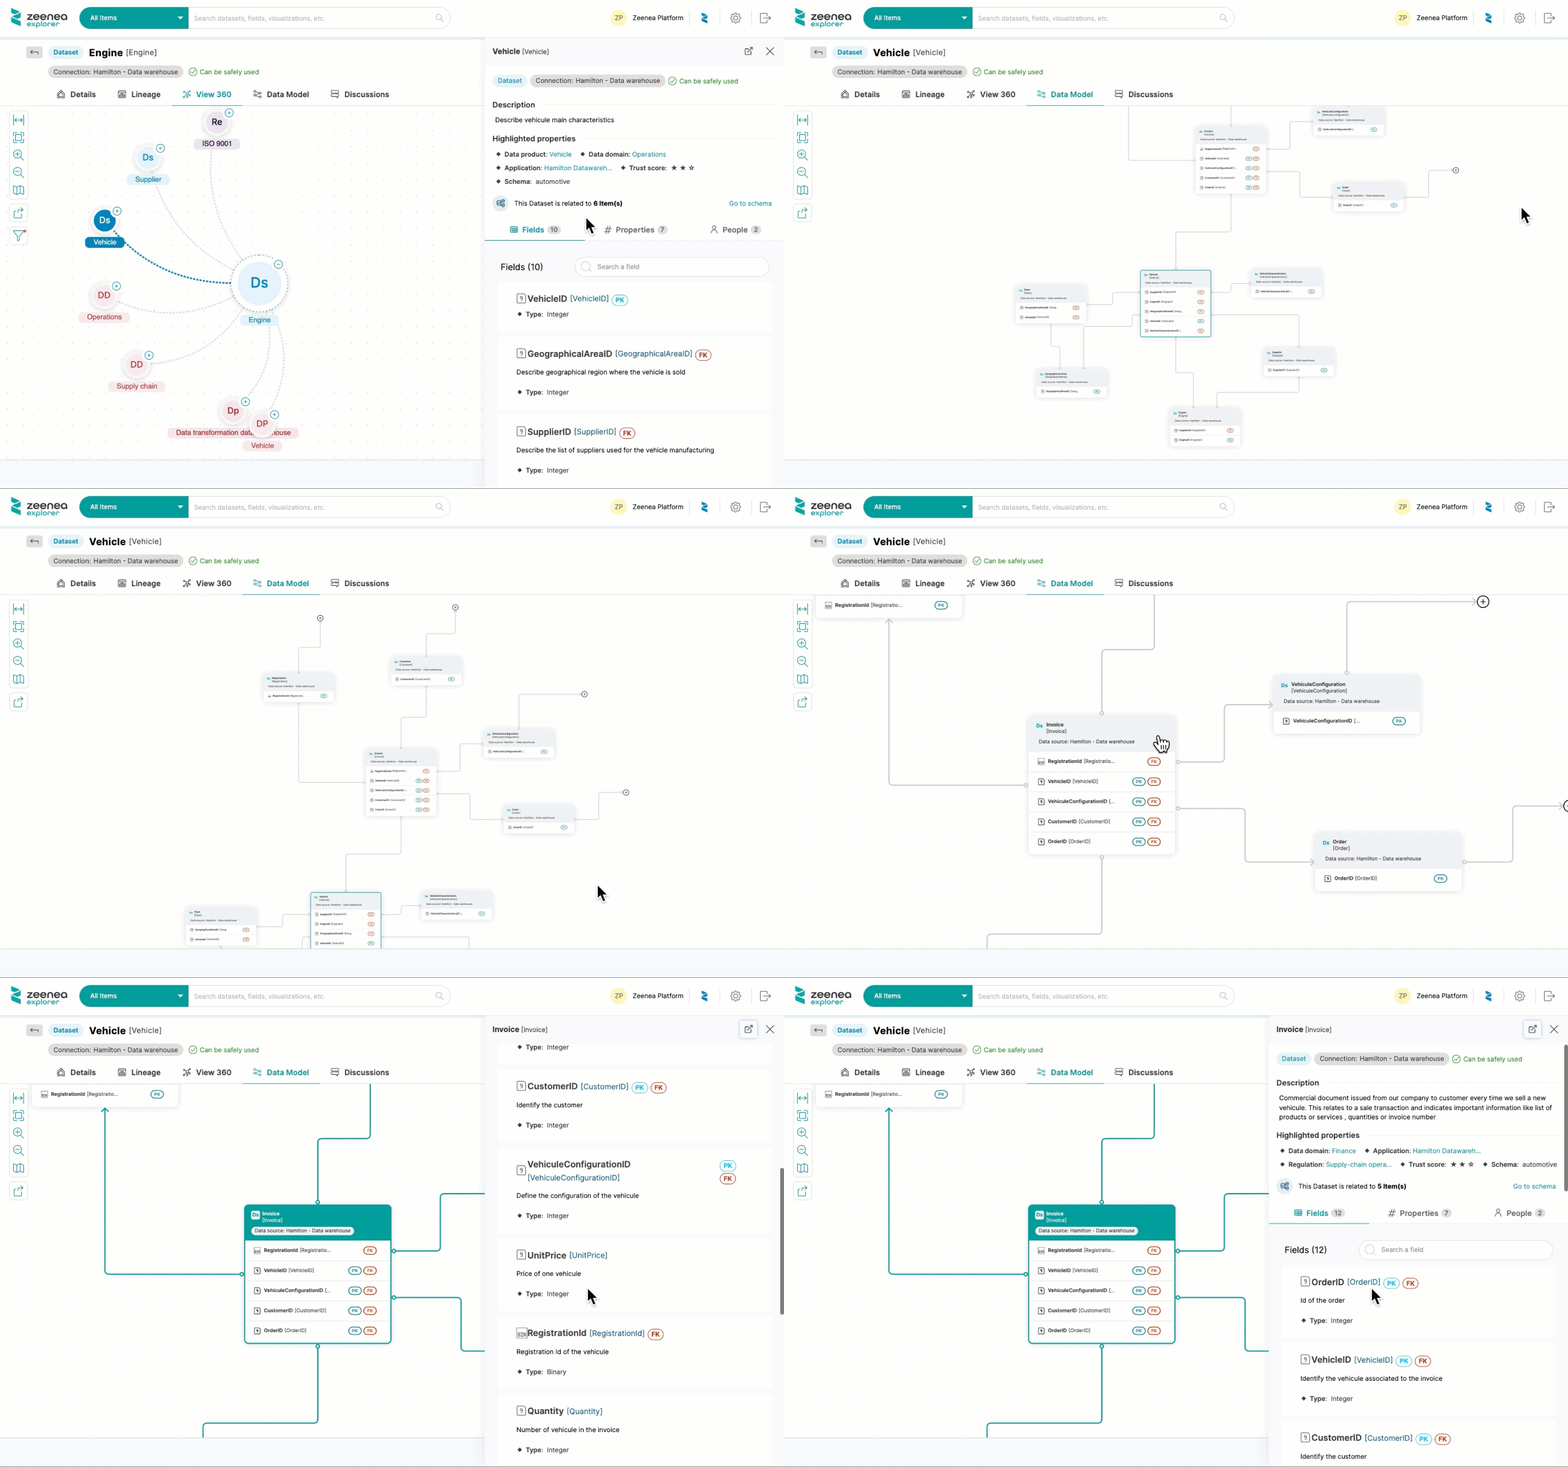
For Datasets, directly access their Data Model by clicking on the “Go to schema” link. This allows you to visualize an accurate and up-to-date representation of the datasets, as well as the relationships between them within their database.
In addition, click on the selected Item’s title to view its detailed page to view all fields, inputs & outputs, parent/children Glossary Items, implementations, and other metadata – as well as its lineage graph (for Datasets, Data Processes, Visualizations), glossary terms, discussions, etc.
Test our View 360 graph for yourself
Try Zeenea’s View 360 module and all of our other next-gen features by signing up for the Product Tour!


