Data Model: get a visual representation of your physical assets
-
Feature Note
Bridging the gap between the IT and business teams is our primary goal here at Zeenea. In fact, one of the reasons our customers enjoy our platform so much is that our solution offers a graphical and user-friendly interface. One of those components includes the Data Model.
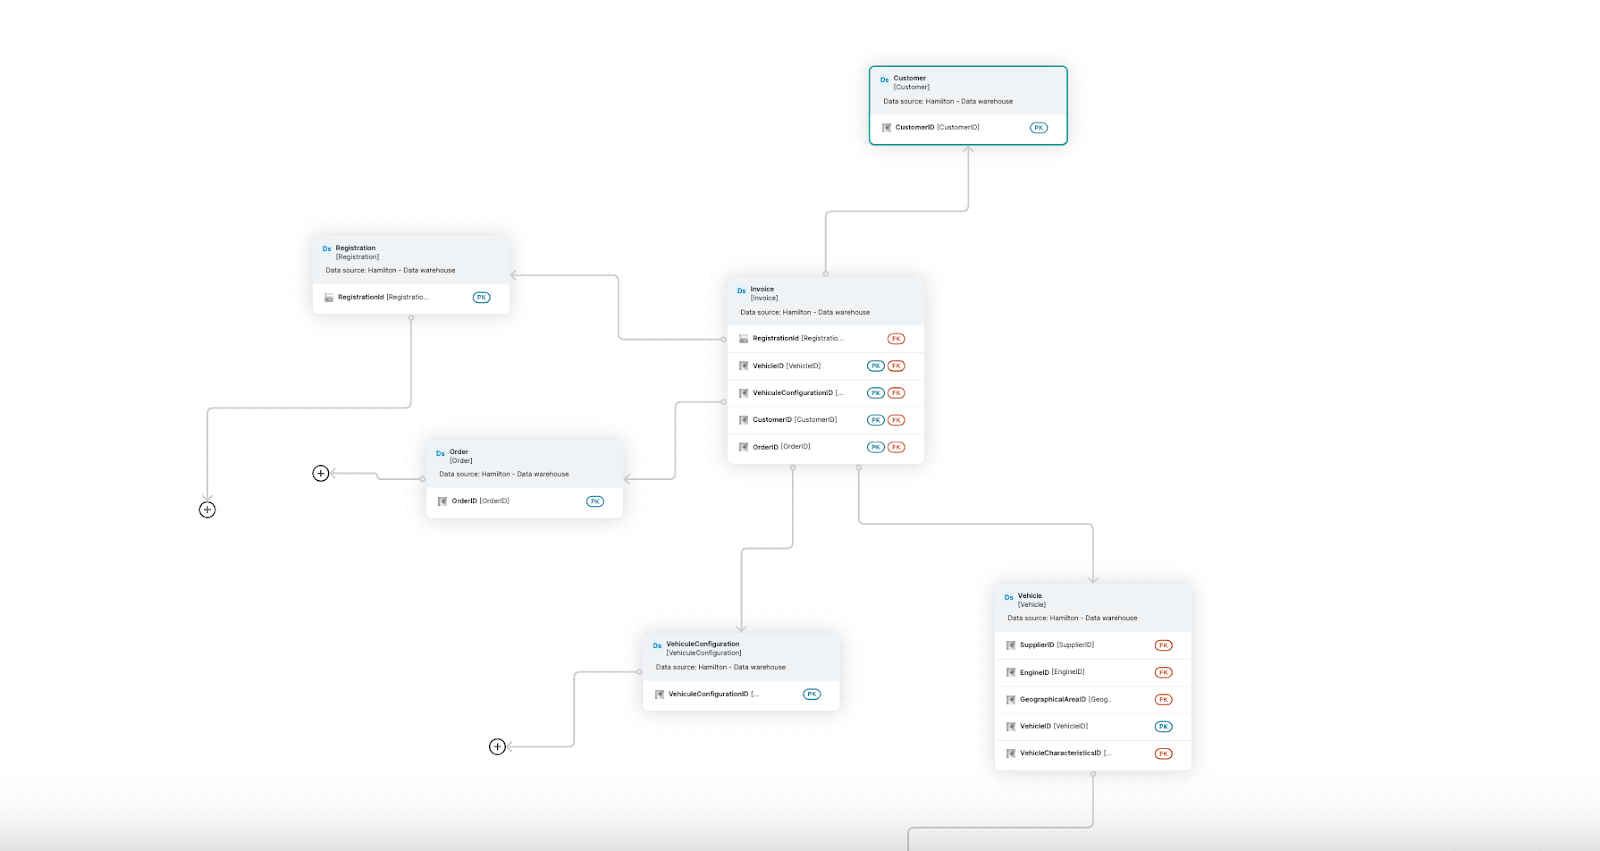
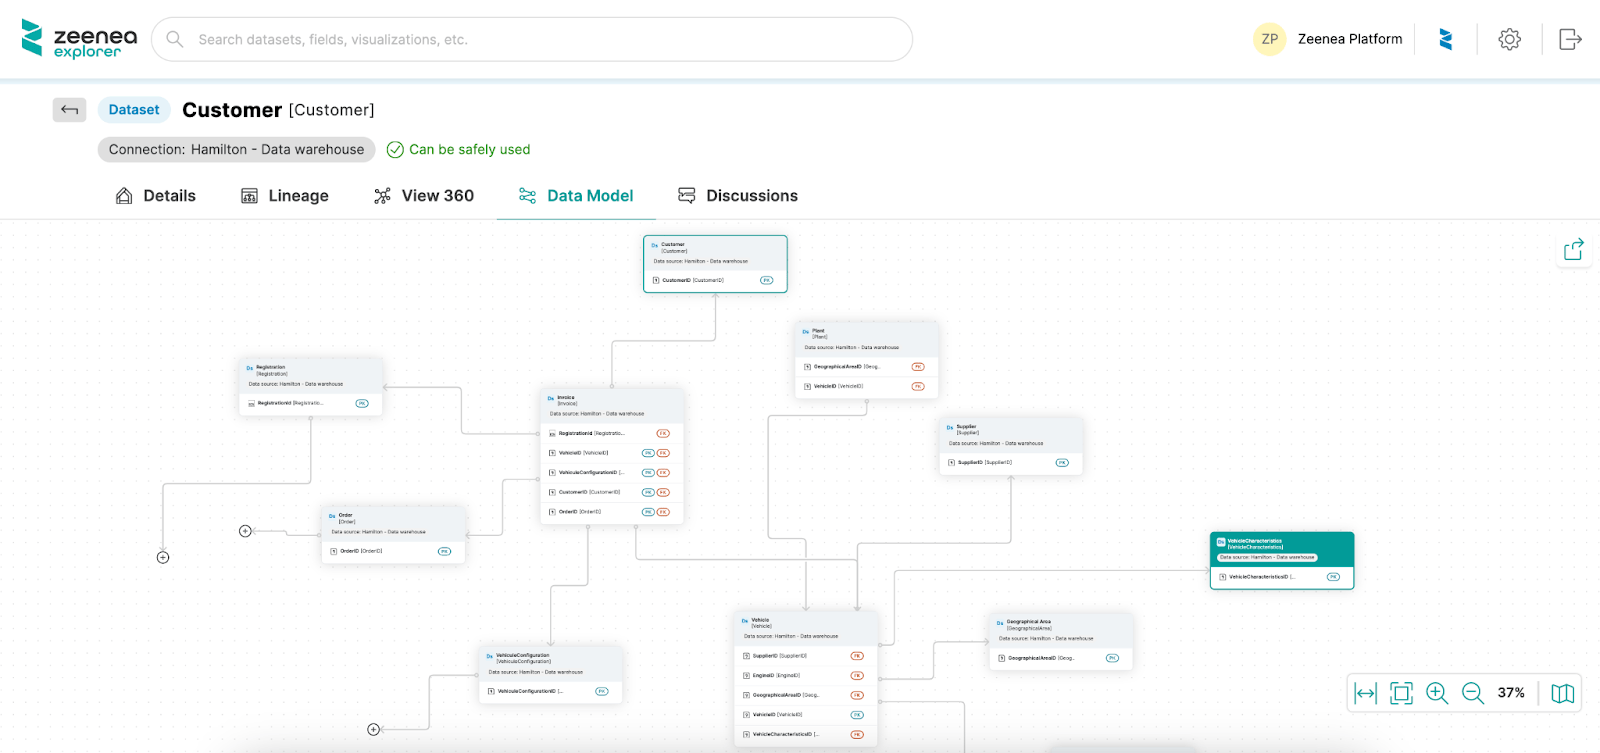
In both Zeenea Studio and Explorer, users have access to an automatically generated Data Model to get a visual representation of their physical assets and their relations in their database. In this feature note, discover all you need to know about our Data Model module!
An automated Data Model
At Zeenea, we are strongly committed to being the unique source of truth for all enterprise data assets, no matter the source. Our mission is for data and non-technical users to be able to easily find and discover the information they need when searching for an asset.
This is why the Data Model of your physical assets (datasets, fields) is automatically generated from the source via our connectors, using the primary and foreign keys in your database. In this way, users can visualize an up-to-date and accurate representation of the datasets and relations between the datasets of their database.
Therefore, the Data Model in Zeenea cannot be modified. However, in Zeenea Studio, Data Stewards can add a description to the relations between their physical data assets!
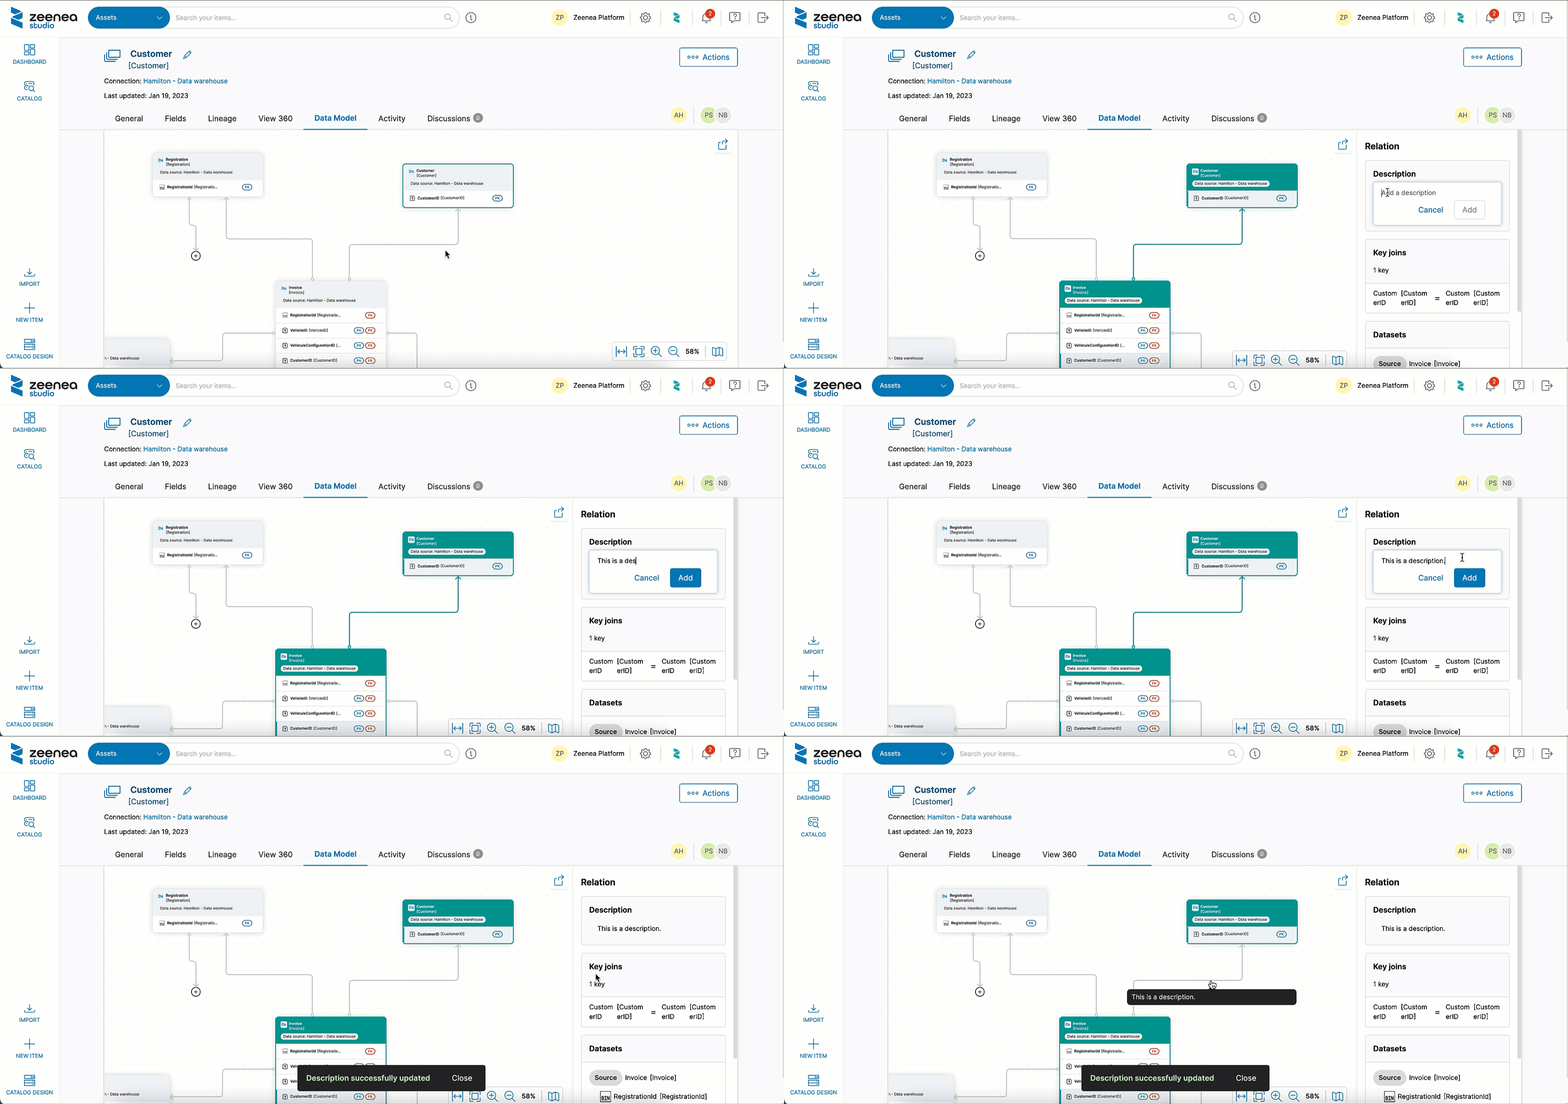
Data consumers who use Zeenea Explorer will also be able to understand the context of the relation between their datasets, fields, etc.

Easily explore your Data Model
Our Data Model was designed for everyone to easily explore and discover the relations between their organization’s physical assets. By default, Zeenea displays the direct relation from up to two levels away – for companies that have hundreds and thousands of tables, it would be overwhelming to display all relations on the graph.
However, if you wish to go further and display other relations, you can click on the “+” button.
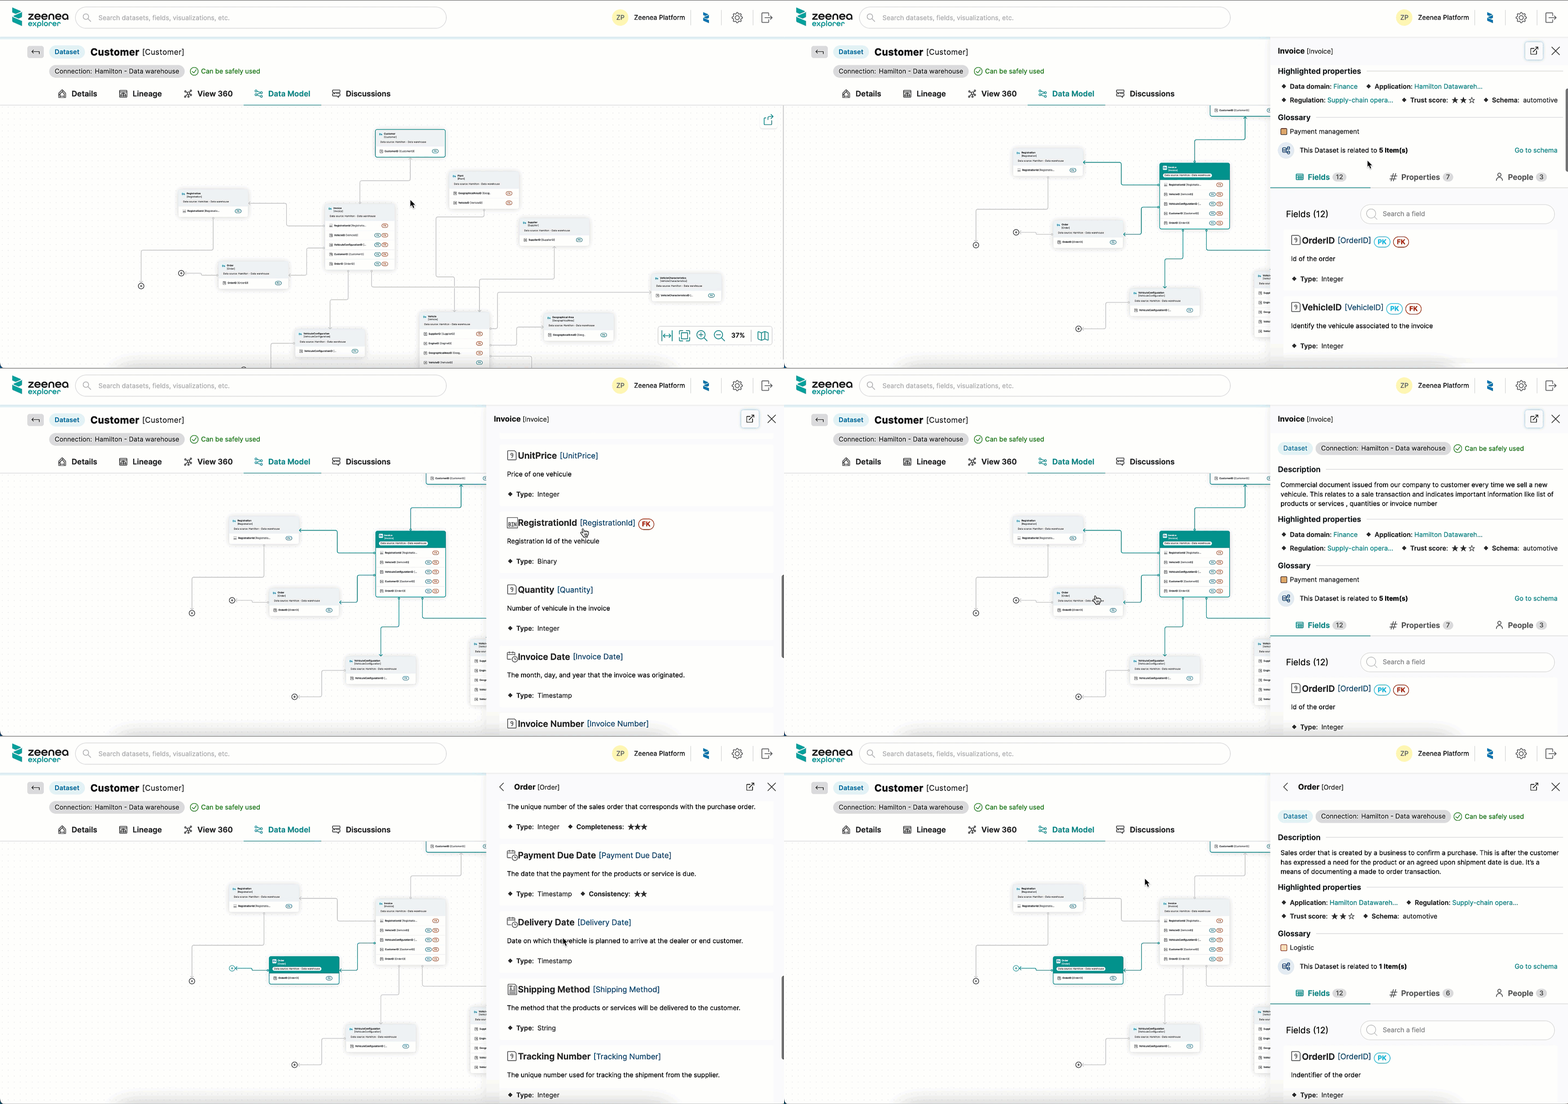
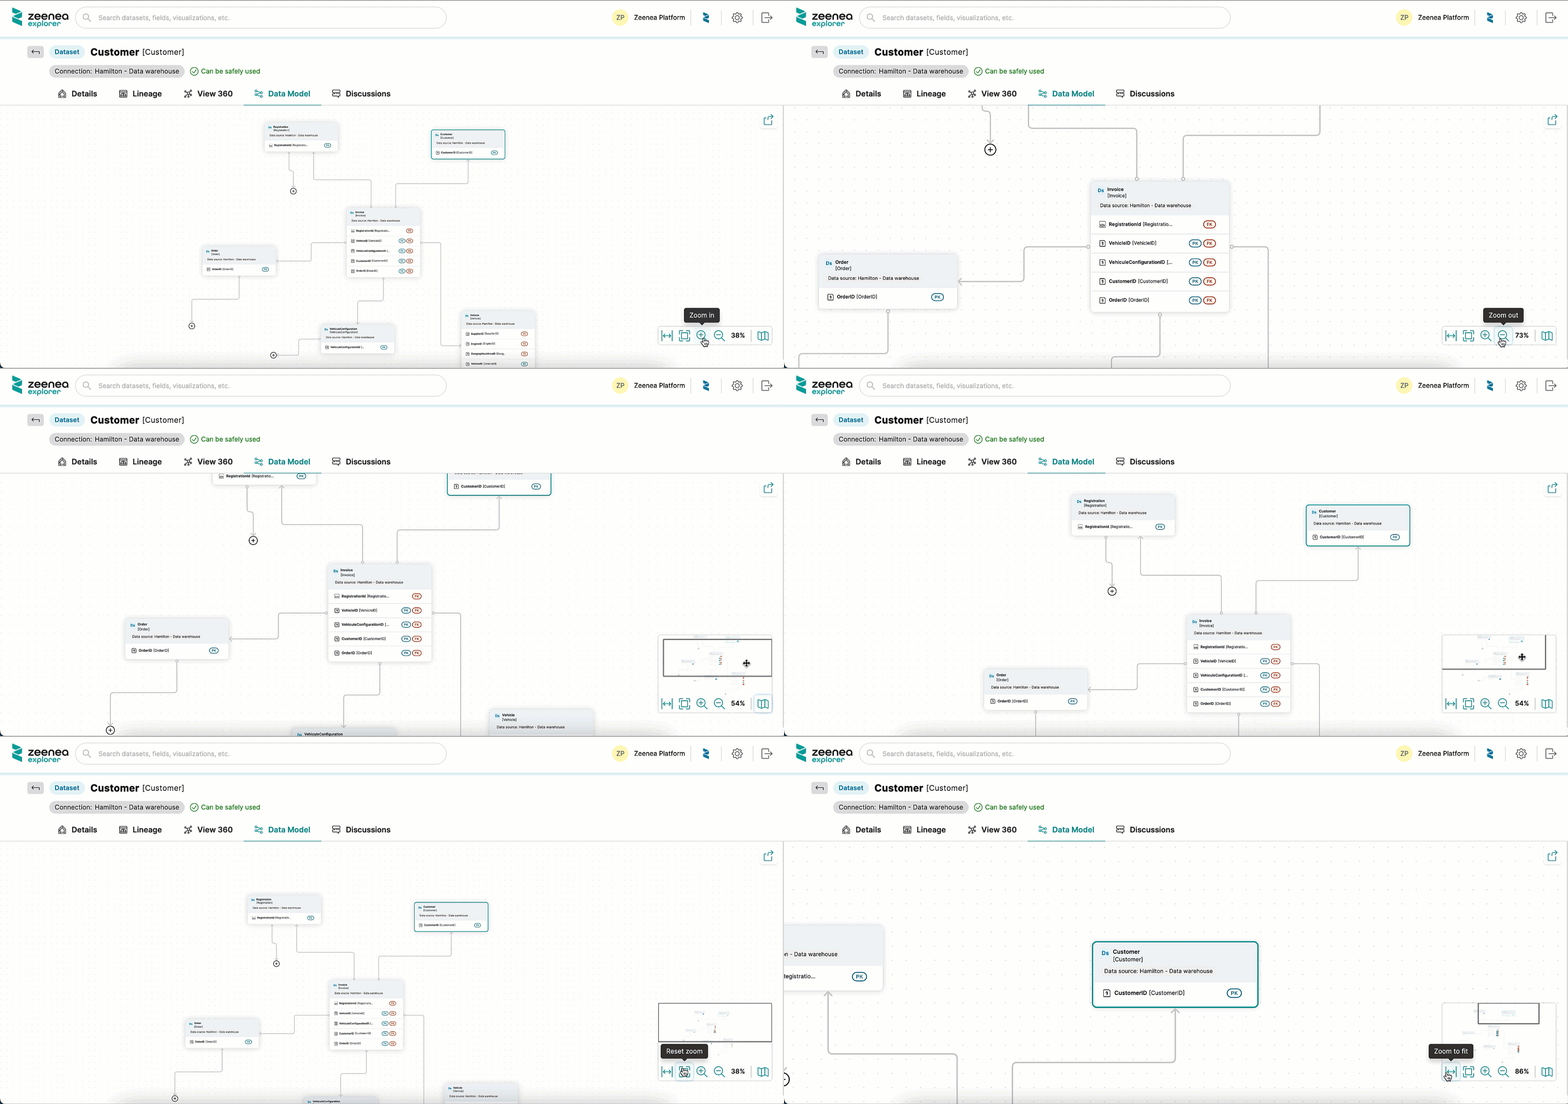
Bonus: Export your graph in PNG format to share it with your data team members!

Test our Data Model for yourself!
Try Zeenea’s Data Model module and all of our other next-gen features by signing up for the Product Tour!
