
Blog
Be(come) Data Fluent
Read the latest trends on big data, data cataloging, data governance and more on Zeenea’s data blog.
Join our community by signing up to our newsletter!


Categories

Data Catalog

Data Governance

Inspiration
Metadata Management

Data Compliance

Data Mesh

How you’re going to fail your data catalog project (or not…)
There are many solutions on the data catalog market that offer an overview of all enterprise data all thanks to ...

How Spotify improved their Data Discovery for their Data Scientists
As the world leader in the music streaming market, it is without question that the huge firm is driven by ...

Metadata through the eyes of Web Giants
Data life cycle analysis is an element in data management that enterprises are still struggling to ...

Amundsen: How Lyft is able to easily discover their data
In our last article, we spoke of Uber’s Databook , an in-house platform designed by their very own engineers with ...
How does Zeenea Data Catalog empower your data teams?
Data has become one of the main drivers for innovation for many sectors.And as data continues to rapidly ...

CANCELLED – Zeenea is a sponsor at the Gartner Data & Analytics Summit 2020!
THE EVENT IS CANCELLEDDue to Covid-19, the event is cancelled.
We hope to see you soon in another ...

Join Zeenea online at the Data Innovation Summit 2020!
Zeenea is proud to announce that we will be sponsoring at this year’s Data Innovation Summit on August 18th - ...

Databook: How Uber turns data into exploitable knowledge with metadata
Uber is one of the most fascinating companies to emerge over the past decade. Founded in 2009, Uber grew to become ...

Zeenea Data Catalog now connects to Snowflake!
Zeenea announces the launching of its Snowflake connector already up and running with its clients. In order to ...

What is metadata management?
"By 2021, organizations will spend twice as much effort in managing metadata compared with 2018 in order to ...
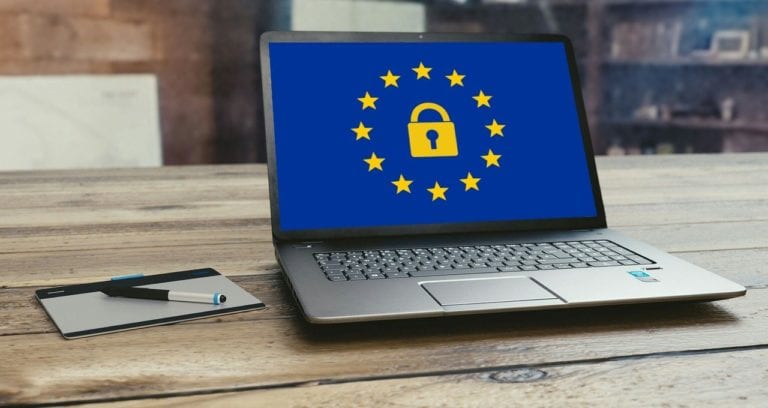
The DPO in 2019: the results are in!
Since May 2018, the General Data Protection Regulations (GDPR) requires companies to assign a “DPO”, or Data ...

Zeenea’s Fresh New Look: The right time to change!
For the past three years, we’ve been working alongside enterprises who wish to lift innovation barriers by ...
No results found.

