Product Release – November 2023
-
Release
Our newest features
Get Field-level information on your Data Lineage graph!
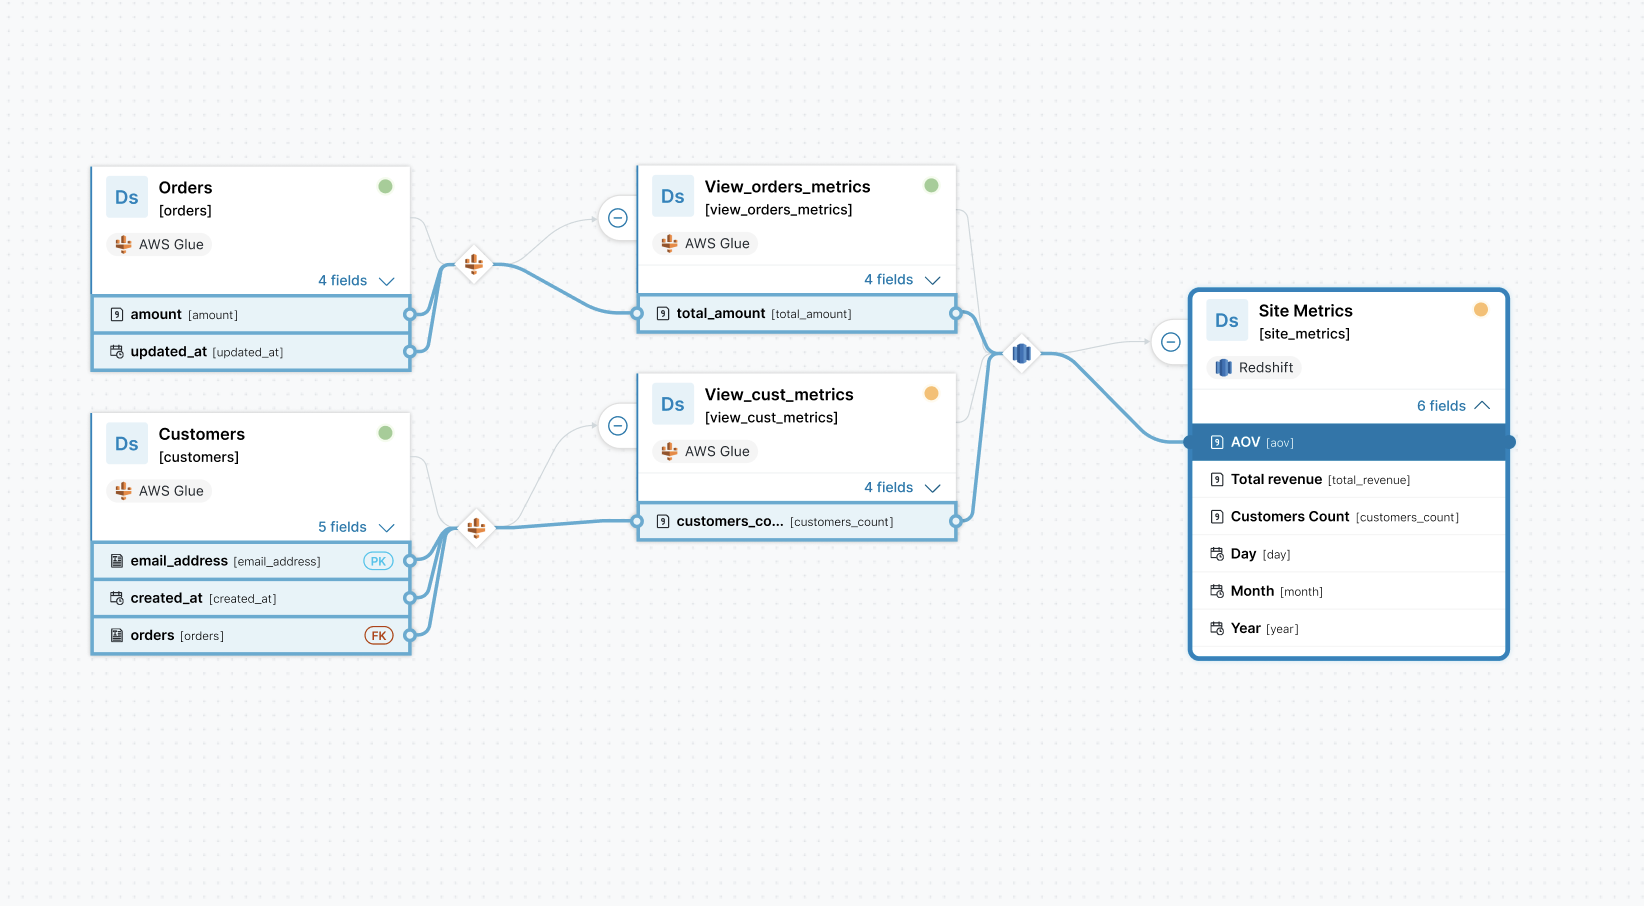
Our data lineage graph now provides information at the Field level!
Via our Catalog API, add the input and output Fields of your data processes to complete your Data Lineage. Then, directly view your Field level transformations in the graph in both Zeenea Explorer and Zeenea Studio. This update includes:
- In the Lineage graph of your Datasets or Data Processes, simply click on the Fields dropdown button to unveil the transformation processes applied to each Field.
- The transformation process of your Fields is highlighted, and the other components are shaded.
- You can always expand your Field-level lineage by clicking on the “+” in the graph.
- For a more detailed perspective, head to the new “Operations” tab on your Data Process detail pages in Zeenea Studio. Here, you can view all field transformations along with their descriptions in list format.
A fresh new look for the Zeenea Studio Dashboard
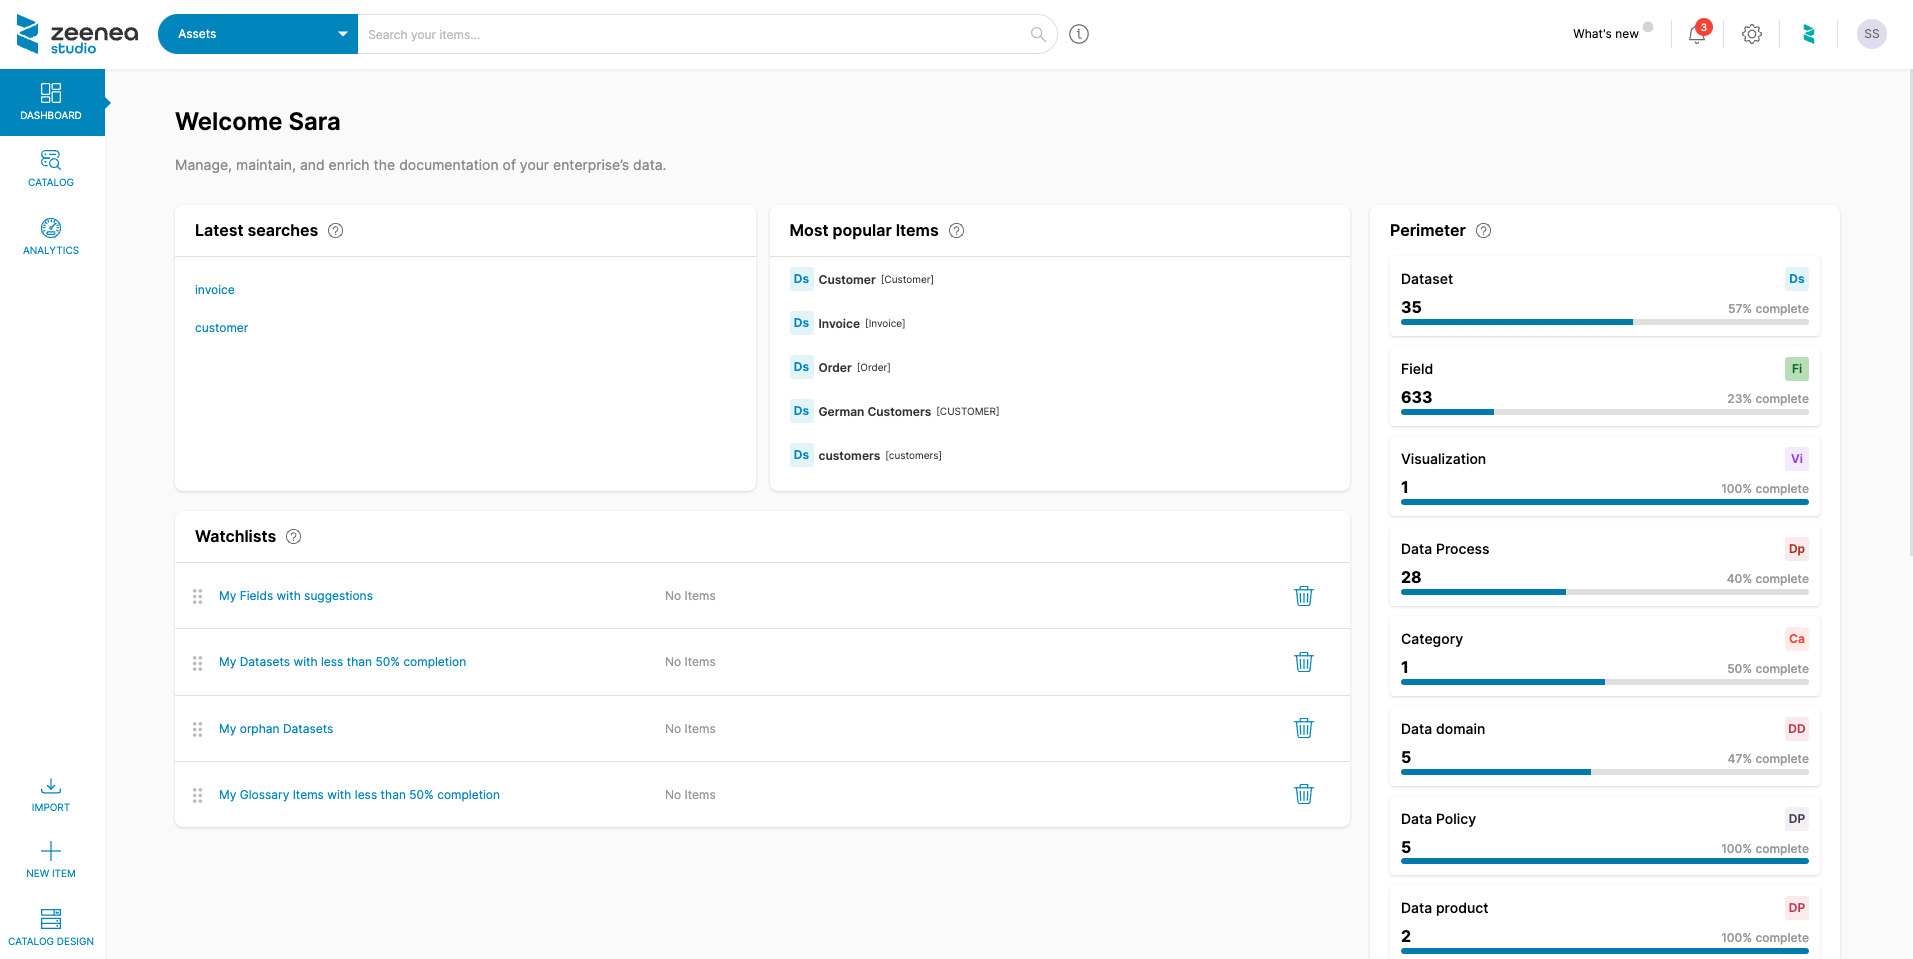
From a personalized welcome to a more detailed view of the Items of your perimeter, our dashboard in Zeenea Studio has evolved! What’s new?
New Perimeter design: Your perimeter now extends beyond Dataset completion – it includes all the Items that you are a Curator for, including Fields, Data Processes, Glossary Items, and Custom Items.
Watchlists: Data Stewards can now create Watchlists to easily access the Items that require a specific action. By default, there are four preconfigured Watchlists based on the Items within your perimeter:
- Datasets with less than 50% completion
- Glossary Items with less than 50% completion
- Orphan Datasets
- Fields with pending suggestions
New Latest Searches & Most Popular Items widgets: The User Activity widget is disappearing; now the Latest Searches take into account your latest searches instead of the overall latest searches. The Most Popular Items will take into account the most consulted and used Items of your Perimeter by all users.

A brand new Analytics Dashboard in Zeenea Studio
We’ve added a brand new Analytics Dashboard in Zeenea Studio – easily create and build reports based on the content of your organization’s catalog!
Directly on the Analytics Dashboard page, view the completion level of all your Item Types, including your Custom Items. Each Item Type element is clickable to quickly view the Catalog section filtered by the selected Item Type.
For more information on the completion level of a specific Item Type, easily segment your Item by Property to create a Widget! The Widget will then give you more details including:
- The Item count, Average completion level, and Segment Count
- A graphical component to view your Segments’ completion level at a glance
- On the left-hand side, the completion level of all your Item’s properties, its description, and linked Glossary Items.


