Product Release – March 2024
-
Release
Our newest features
Data Quality API enhancements
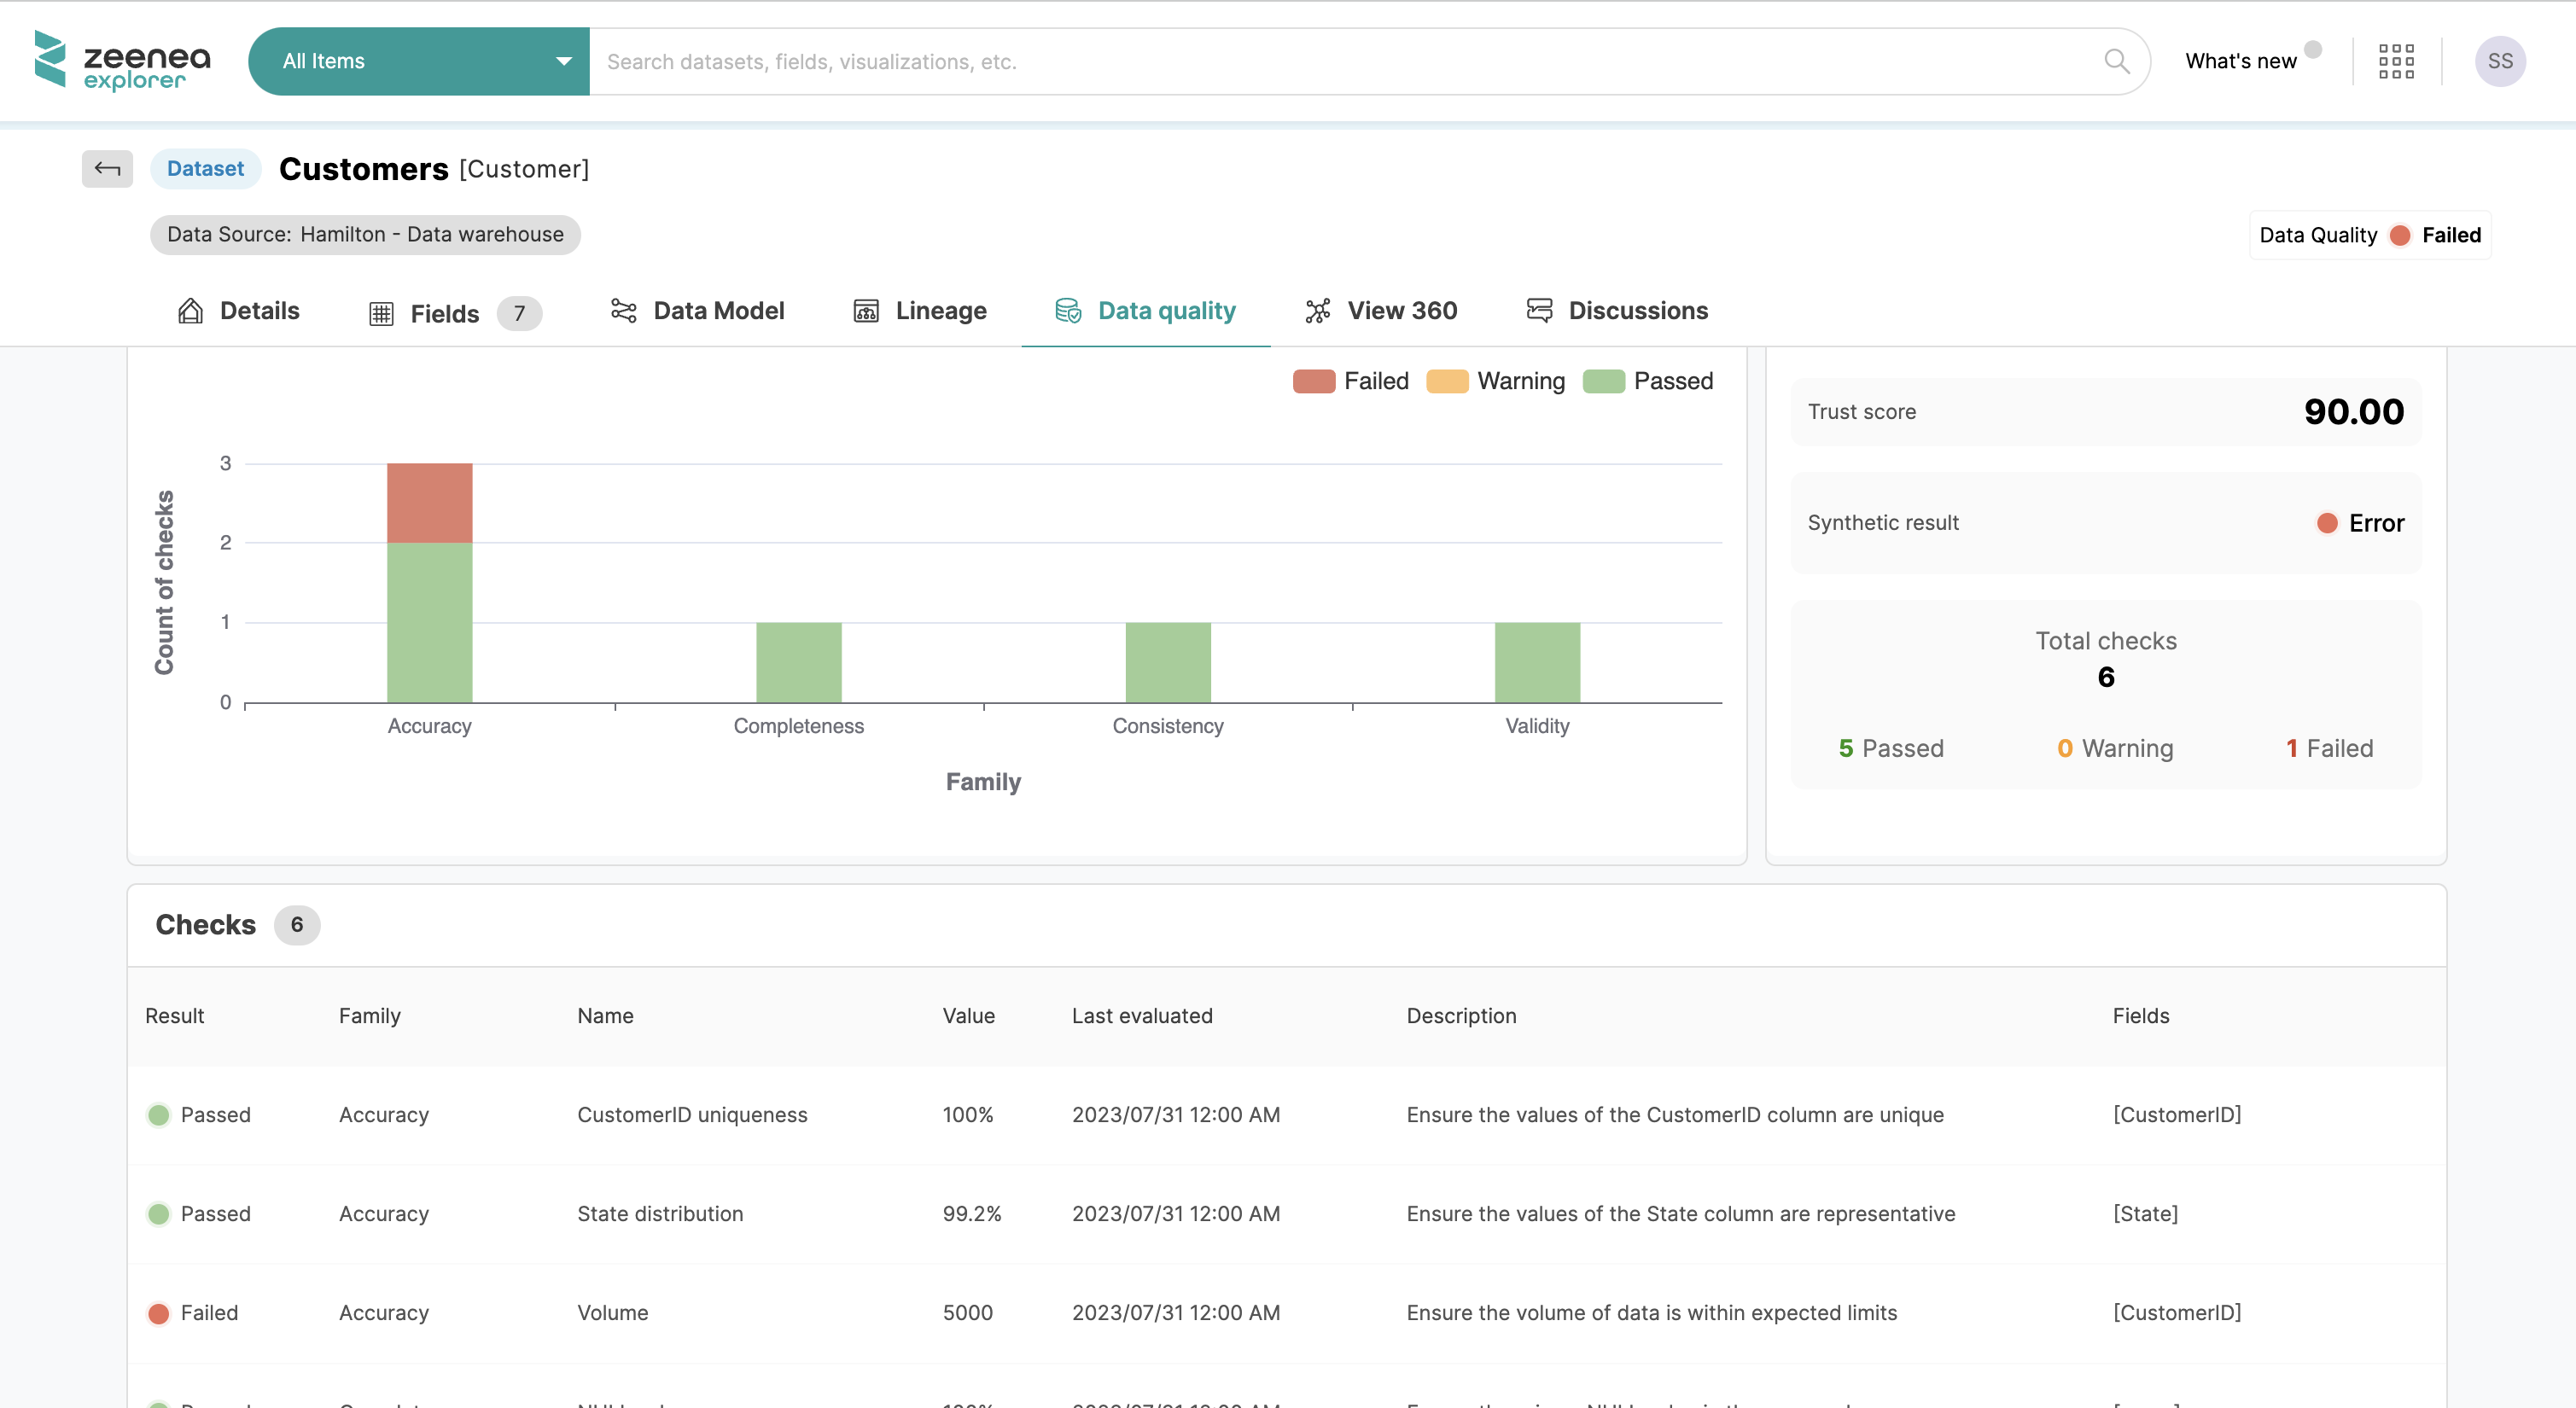
We’ve improved our data quality features!
🆕 What’s new?
- Get Data Quality metrics at the Field level: The Checks table includes a new column labeled ‘Field’, enabling you to identify precisely which field is undergoing quality checks.
- Add numerical values to your quality checks: Users can now incorporate numerical values for quality checks to suit organizations’ different data quality requirements.
We’ve enhanced our description editor in Zeenea Studio!
In addition to putting your texts in bold, italics, strikethrough, add hyperlinks, etc, you now have the ability to modify text color, apply highlights, add special characters, as well as insert more customized lists, tables, images, and more in a rich-text editor.

Directly view your Items information in your external sources
It is now possible to view your Visualizations or Data Processes in your third-party solutions! For example, click on the “View in Tableau” or “View in Matillon” button on top of their detailed page to get more information about your Item.
The feature is available for the following connectors:
- Tableau
- PowerBI SaaS
- Looker
- Qlik Sense
- Matillon
- Microstrategy
- SAP Analytics Cloud

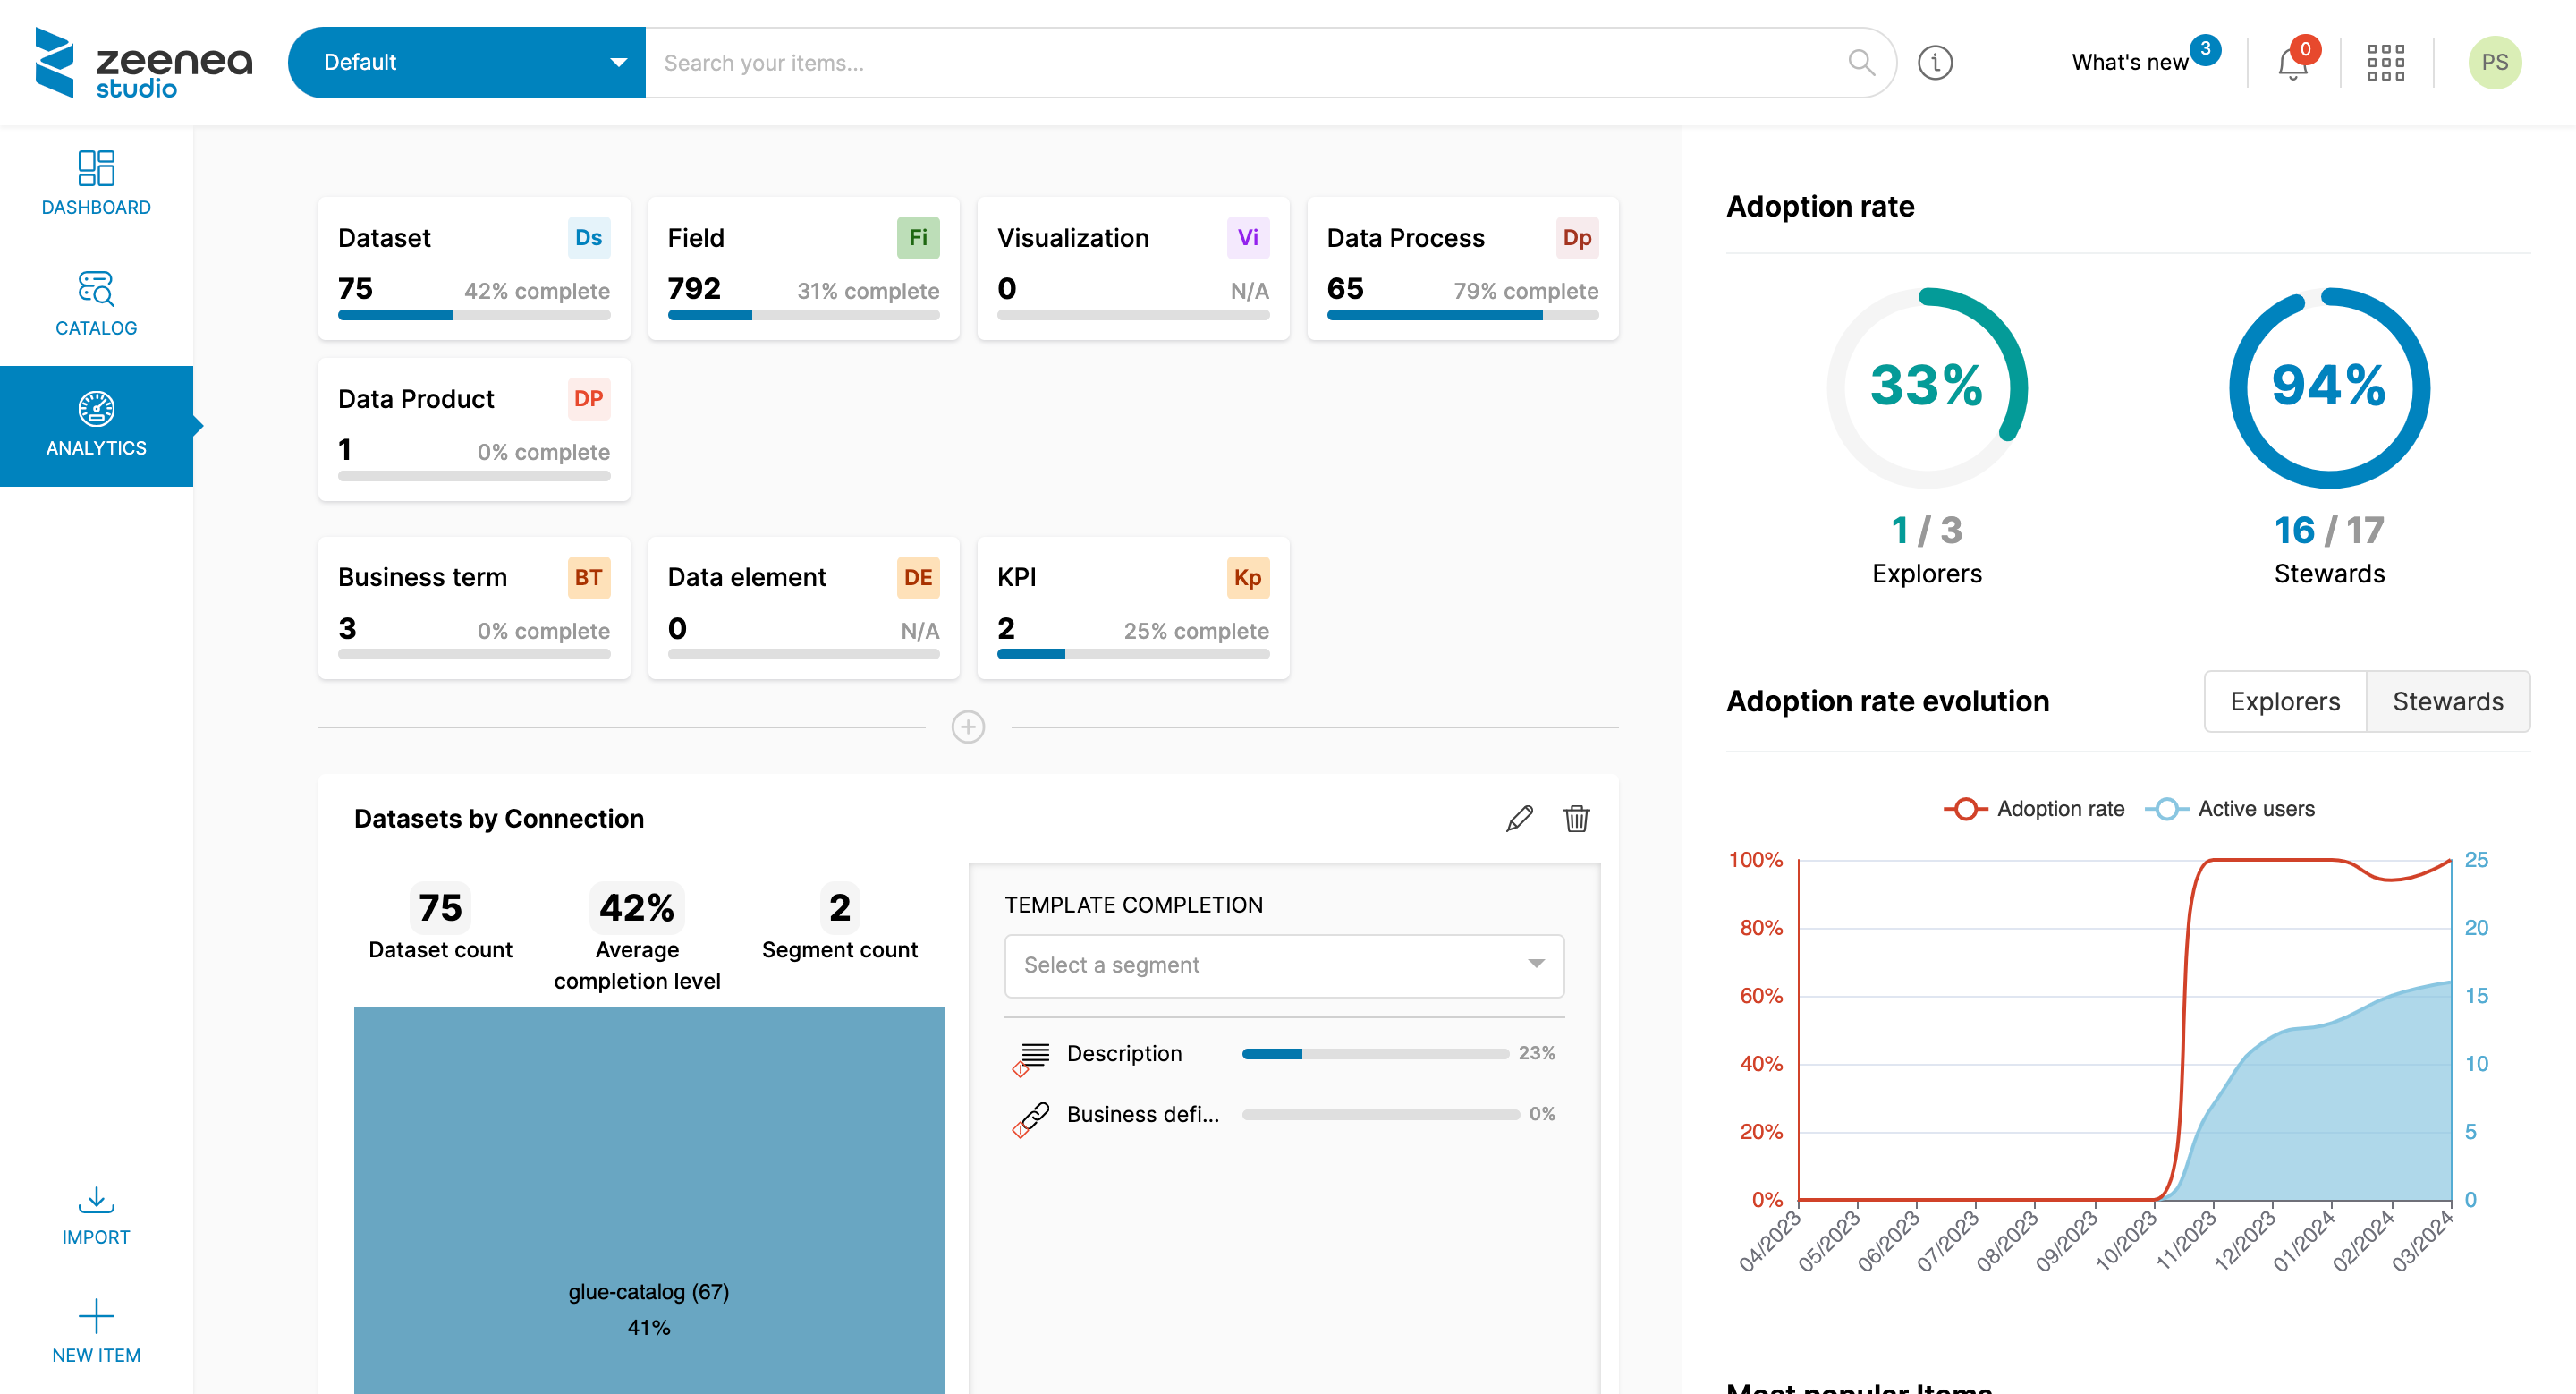
We’ve added adoption metrics for Data Stewards in the Analytics Dashboard
It is now possible to view the Data Stewards adoption rate and its evolution! Next to the Explorers graph, quickly view the number of active Data Stewards out of the total number of onboarded Data Stewards.
In addition, you can easily switch from one adoption rate evolution graph to another by clicking on the “Stewards” or “Explorers” button.
A new Operations tab in Zeenea Explorer
Just like in Zeenea Studio, Explorer users now have an “Operations” tab in the Data Processes detail pages – view all field transformations along with their descriptions in list format.

New connectors
Zeenea can now connect to:
Qlik Cloud
Qlik Cloud is a cloud-based platform by Qlik, a company specializing in analytics and business intelligence software. It allows users to generate, oversee, and distribute interactive data visualizations and dashboards online.
Start cataloging and analyzing your Qlik Cloud visualizations in Zeenea now!
Google Data Lineage
Google Data Lineage refers to the documentation and visualization API of the flow of data within Google Cloud Platform (GCP) services and systems, in particular Dataplex and Data Catalog. It tracks the origin, transformations, and destinations of data as it moves through various processes and components within GCP.
Start inventorying your Google Data Lineage analyses and the datasets they use within Zeenea!


