Data Lineage: Get the whole data story with Zeenea
-
Feature Note
Data assets are bound to change over time – new data is collected, old data deleted, and existing data updated or modified. This makes it difficult for data leaders to know how to use their data or ensure accurate reporting for their compliance use cases.
For this reason, Zeenea developed a visual and easy-to-interpret data lineage graph so all data and business users can understand and interpret their enterprise information – from its collection to its use, storage, and preservation over time.
In this feature note, discover how Zeenea’s Data Lineage provides a context-rich data ecosystem for your organization!
Automatic lineage mapping
Zeenea’s built-in scanners and APIs enable organizations to automatically collect, consolidate, and link metadata from their data ecosystem. Our catalog therefore automatically builds your lineage graphs from your data sources for your physical Items (datasets, data visualizations, and data processes) in both Zeenea Studio & Explorer.
Lineage can also be mapped for your Custom Items:
- Select the Custom Item Types that can be used as Inputs or Outputs of your Data Processes in your metamodel templates.
- Materialize Datasets or your other assets that can’t be harvested from connectors (i.e. Excel files, external sources, etc.).
- Display logical data flows that do not implicate physical assets.
Powerful traceability capabilities
Whether you are subject to the GDPR, BCBS 239, ISO IDMP, or another regulation, Zeenea provides powerful traceability capabilities for your compliance reports. Our documentation templates enable you to match your regulatory context to always ensure your data is trustworthy and up-to-date.
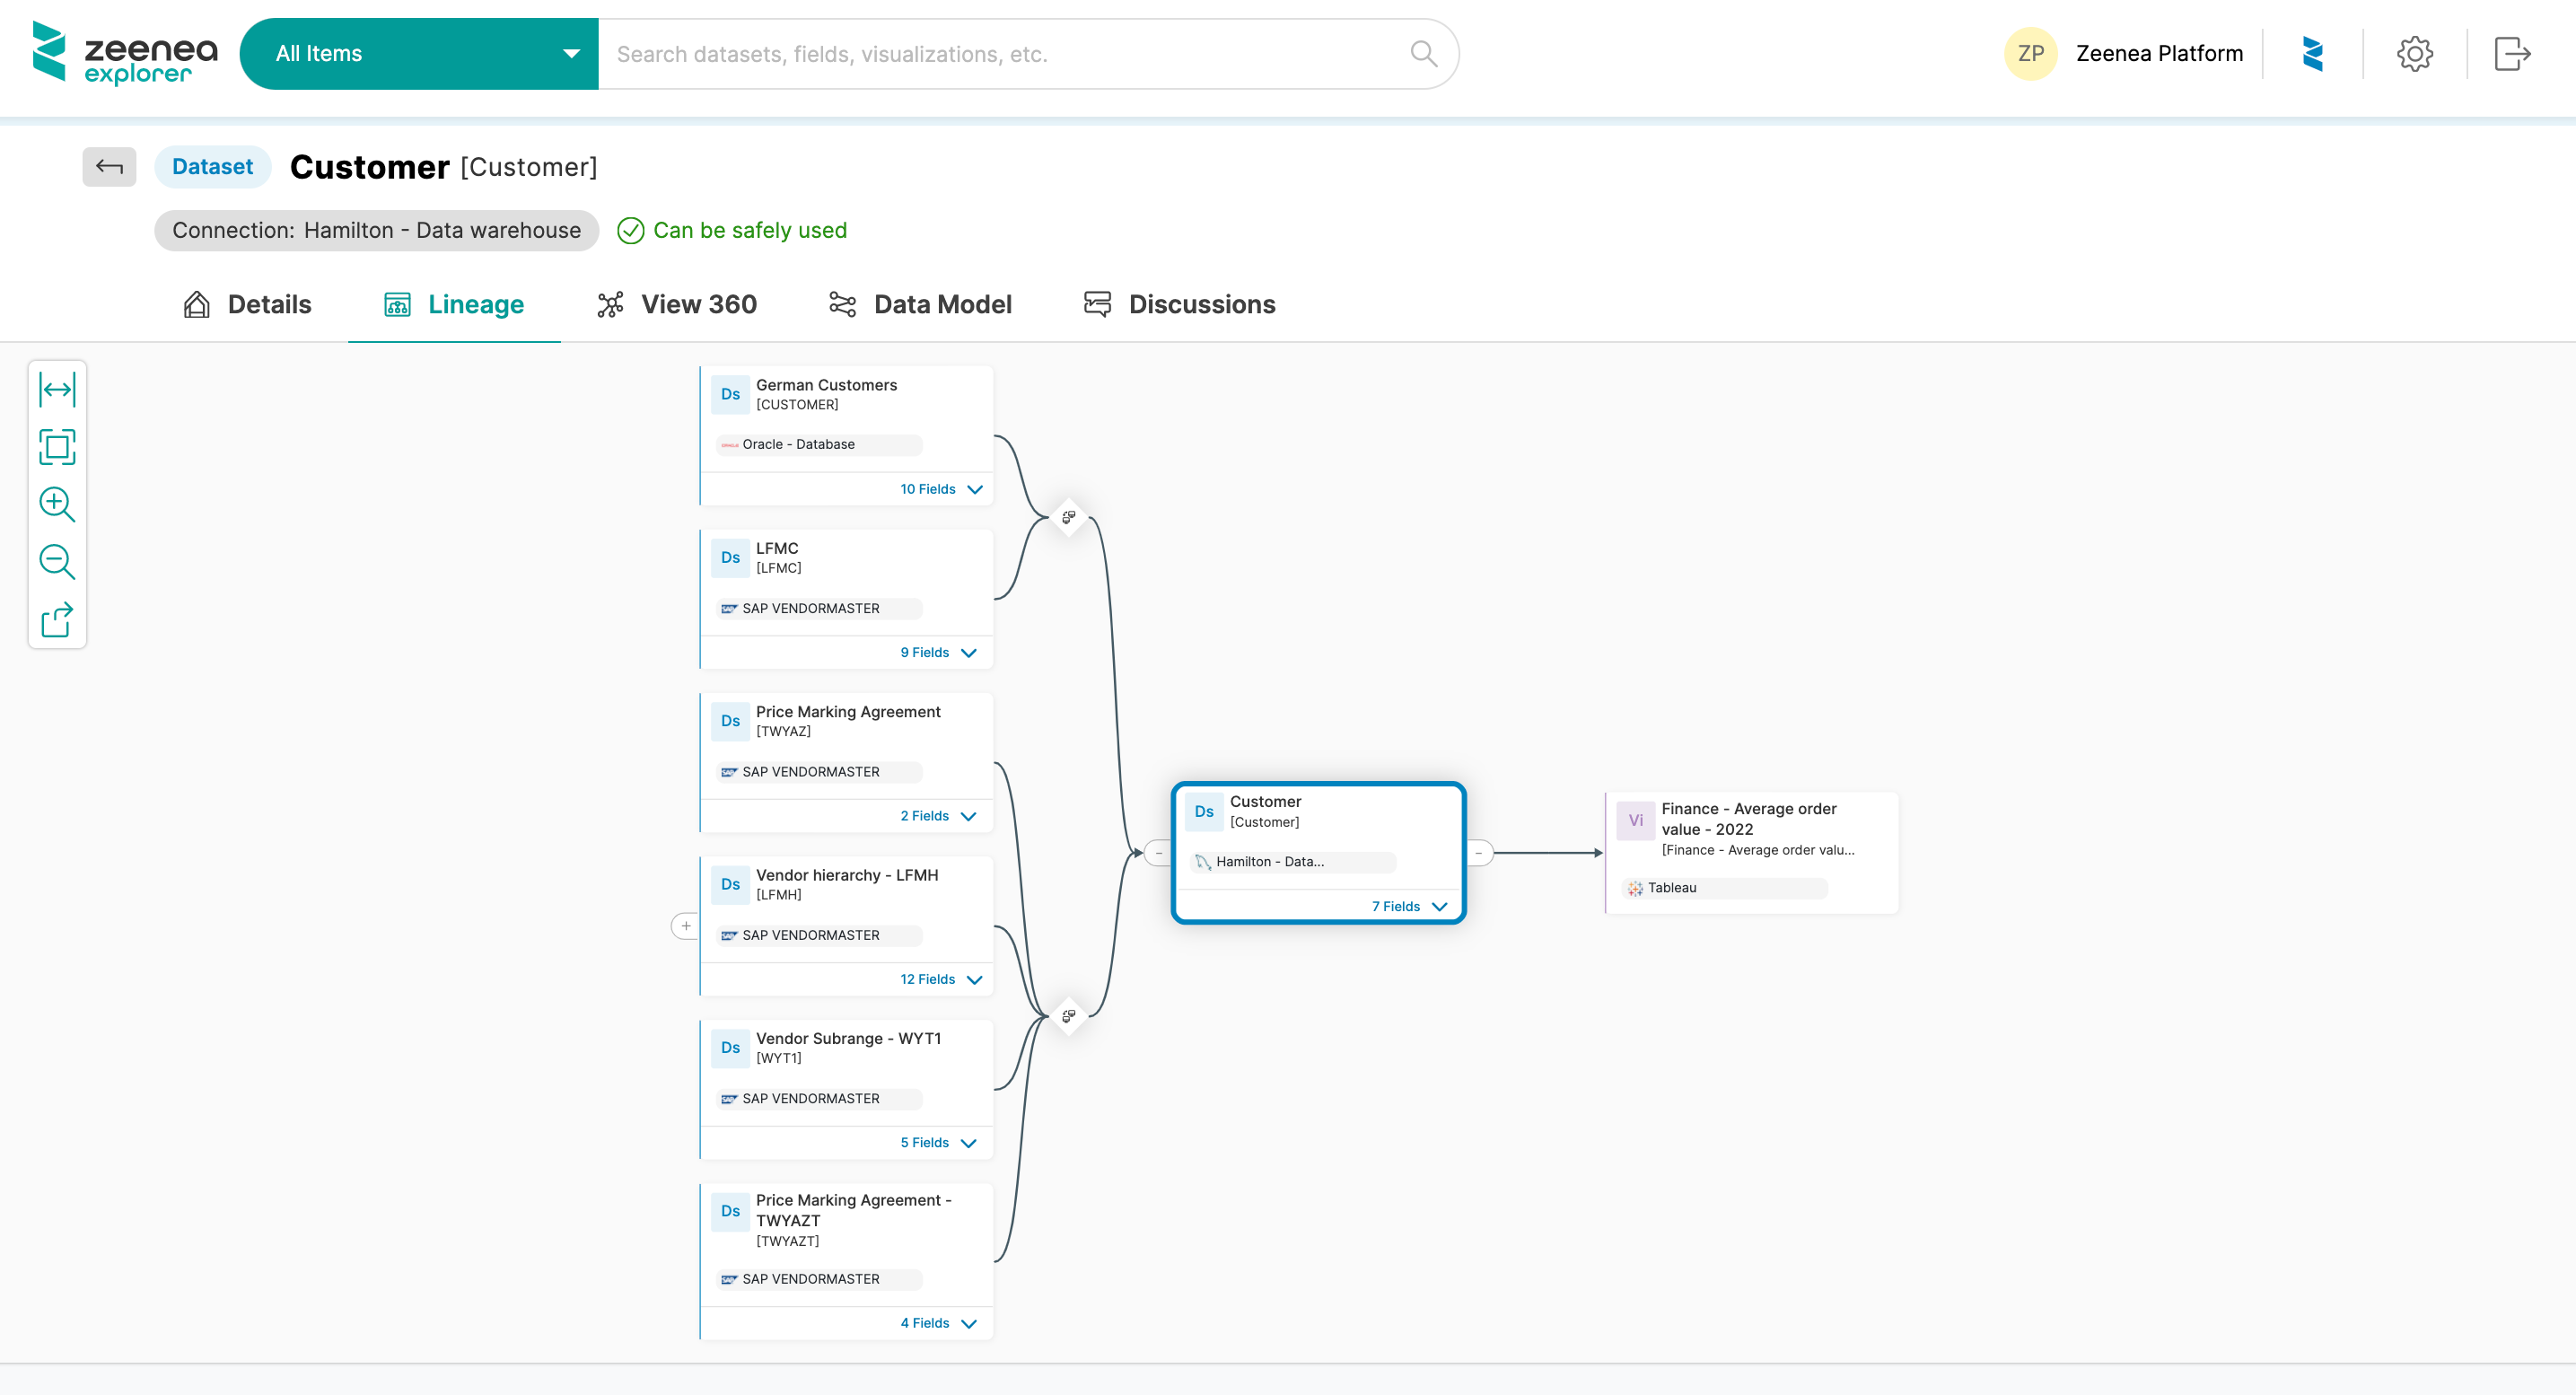
In the graph, each transformation step is directly shown on the Item’s table, from oldest to newest.
Indeed, for companies with hundreds, even thousands, of cataloged Items, we made it so that you can only see the first level of the lineage to avoid the feeling of being overwhelmed while visualizing the graph.
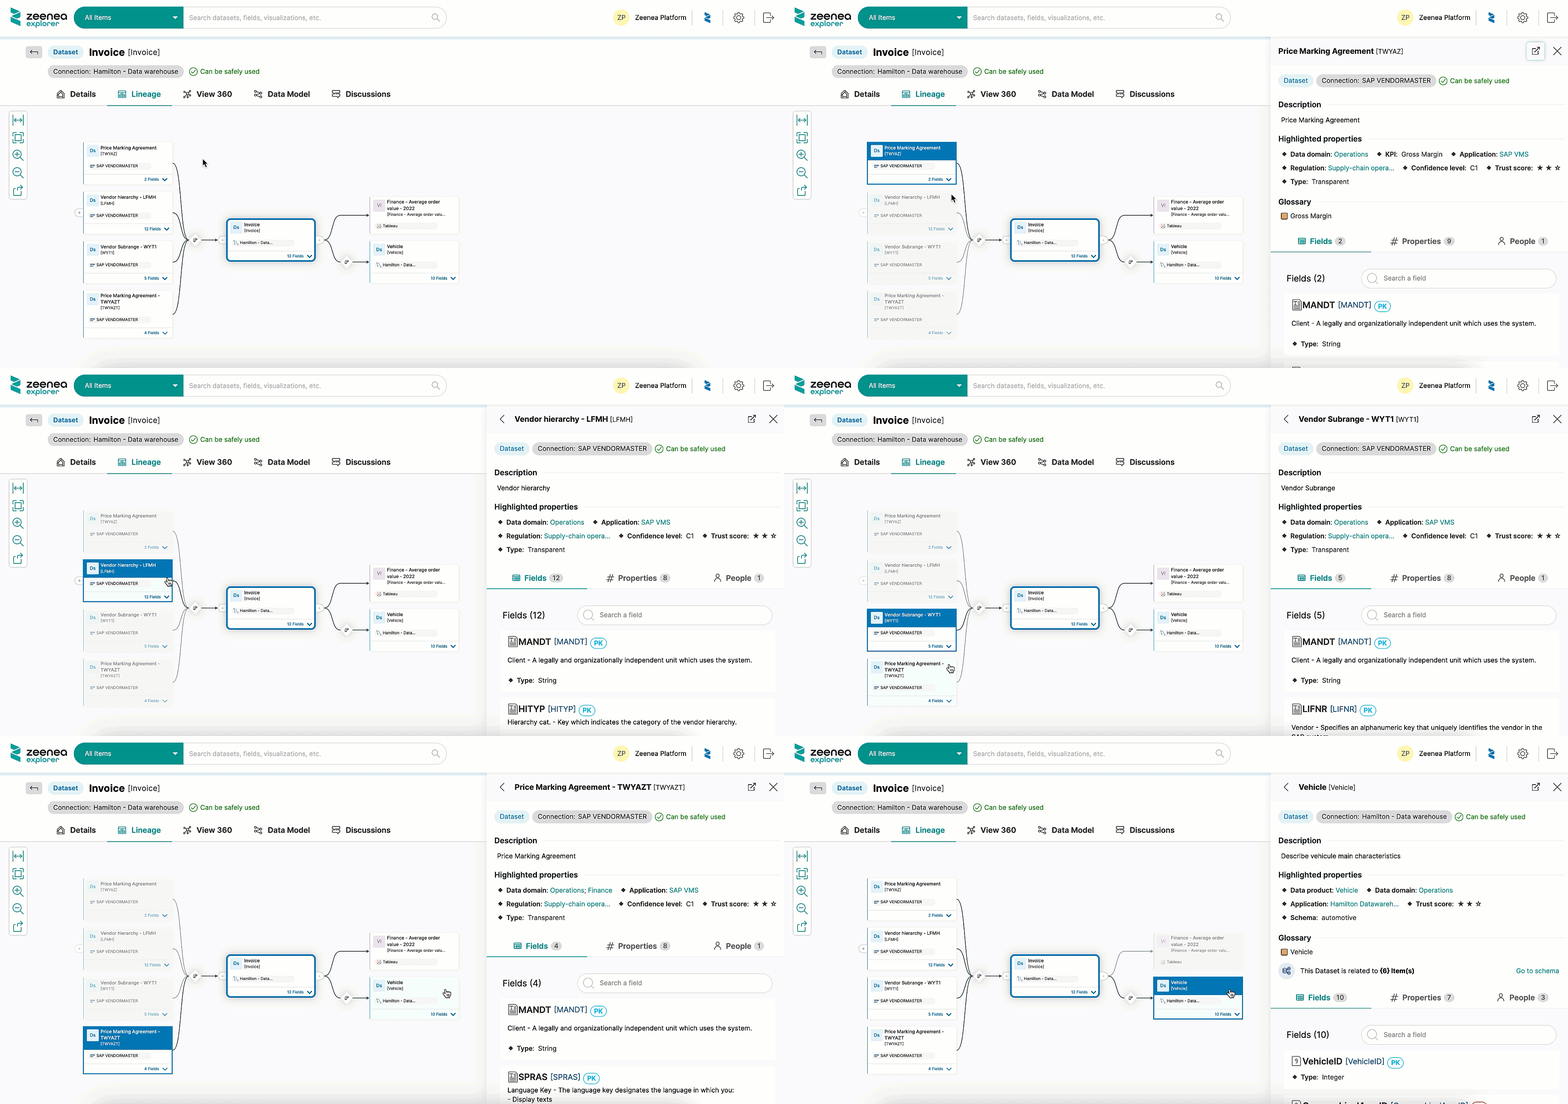
A context-rich lineage graph
To get more context on one of the Items in the graph, you can click on one of the tables and an overview panel will appear on the right-hand side. View the description, highlighted properties, glossary terms, and other metadata such as fields, properties, and associated contacts of the selected Item to verify how accurate, complete, and trustworthy it is.
You may also access the selected Item’s detailed page via the panel to go browse through its information in more detail.

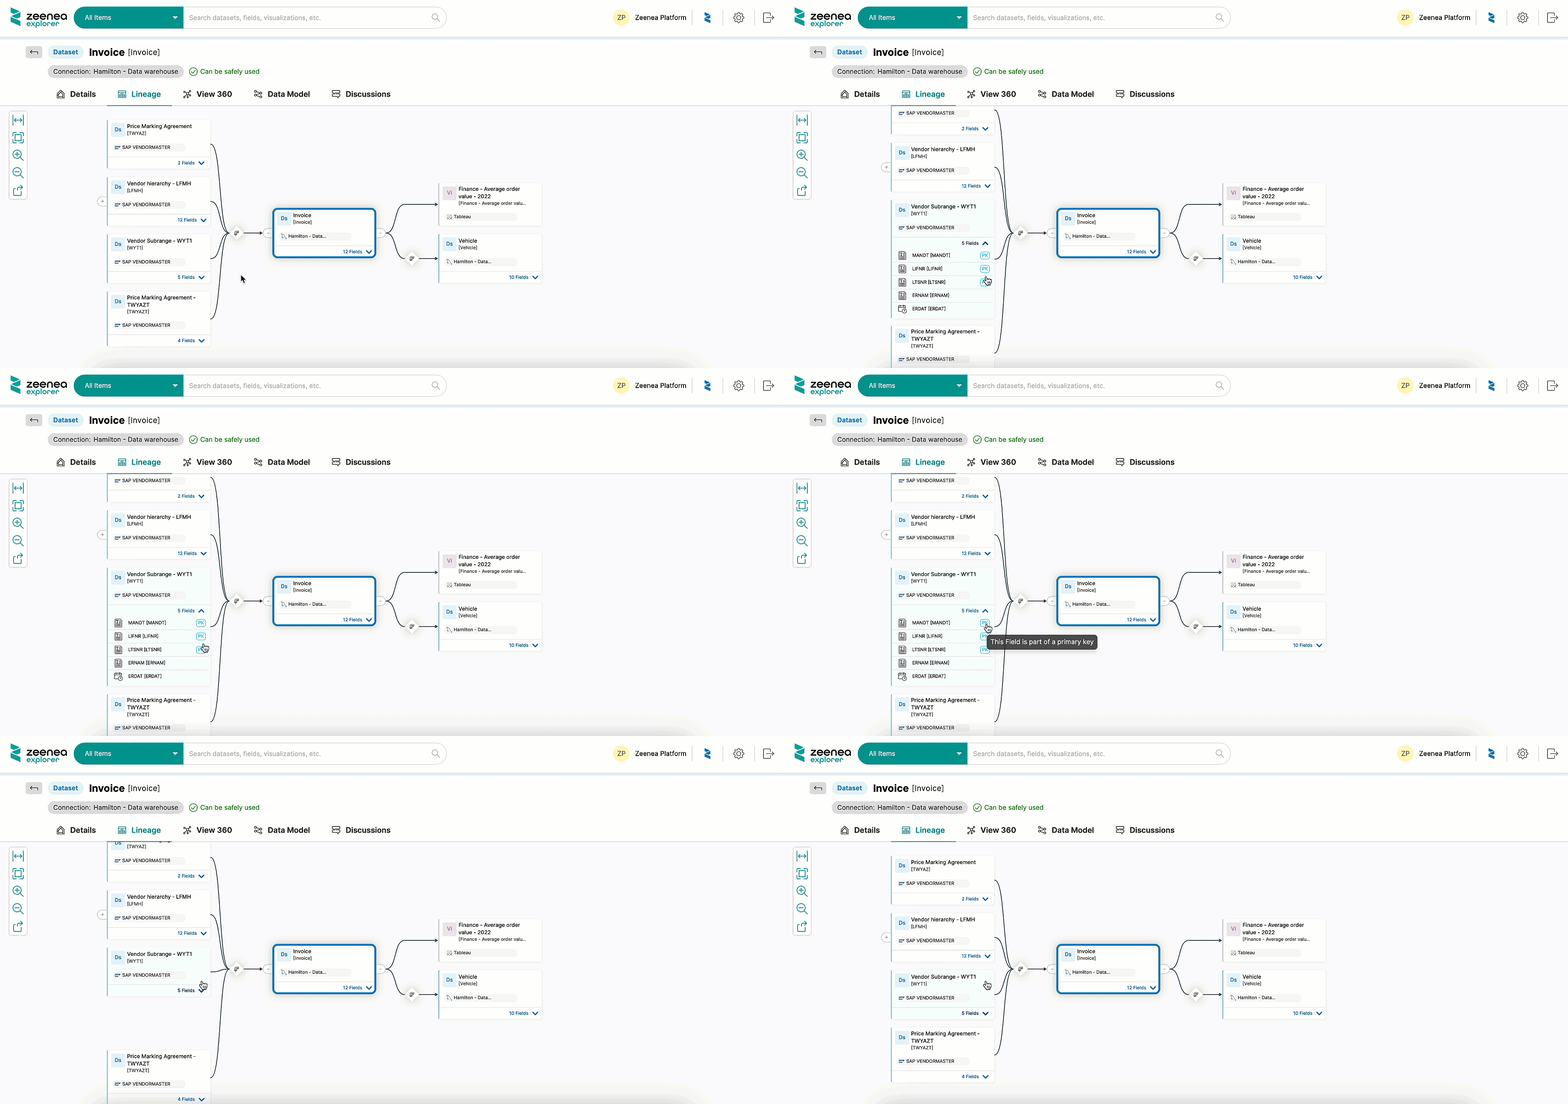
Information at Field-level
Via our Catalog API, add the input and output Fields of your data processes to complete your Data Lineage. Then, directly view your Field level transformations in the graph in both Zeenea Explorer and Zeenea Studio.
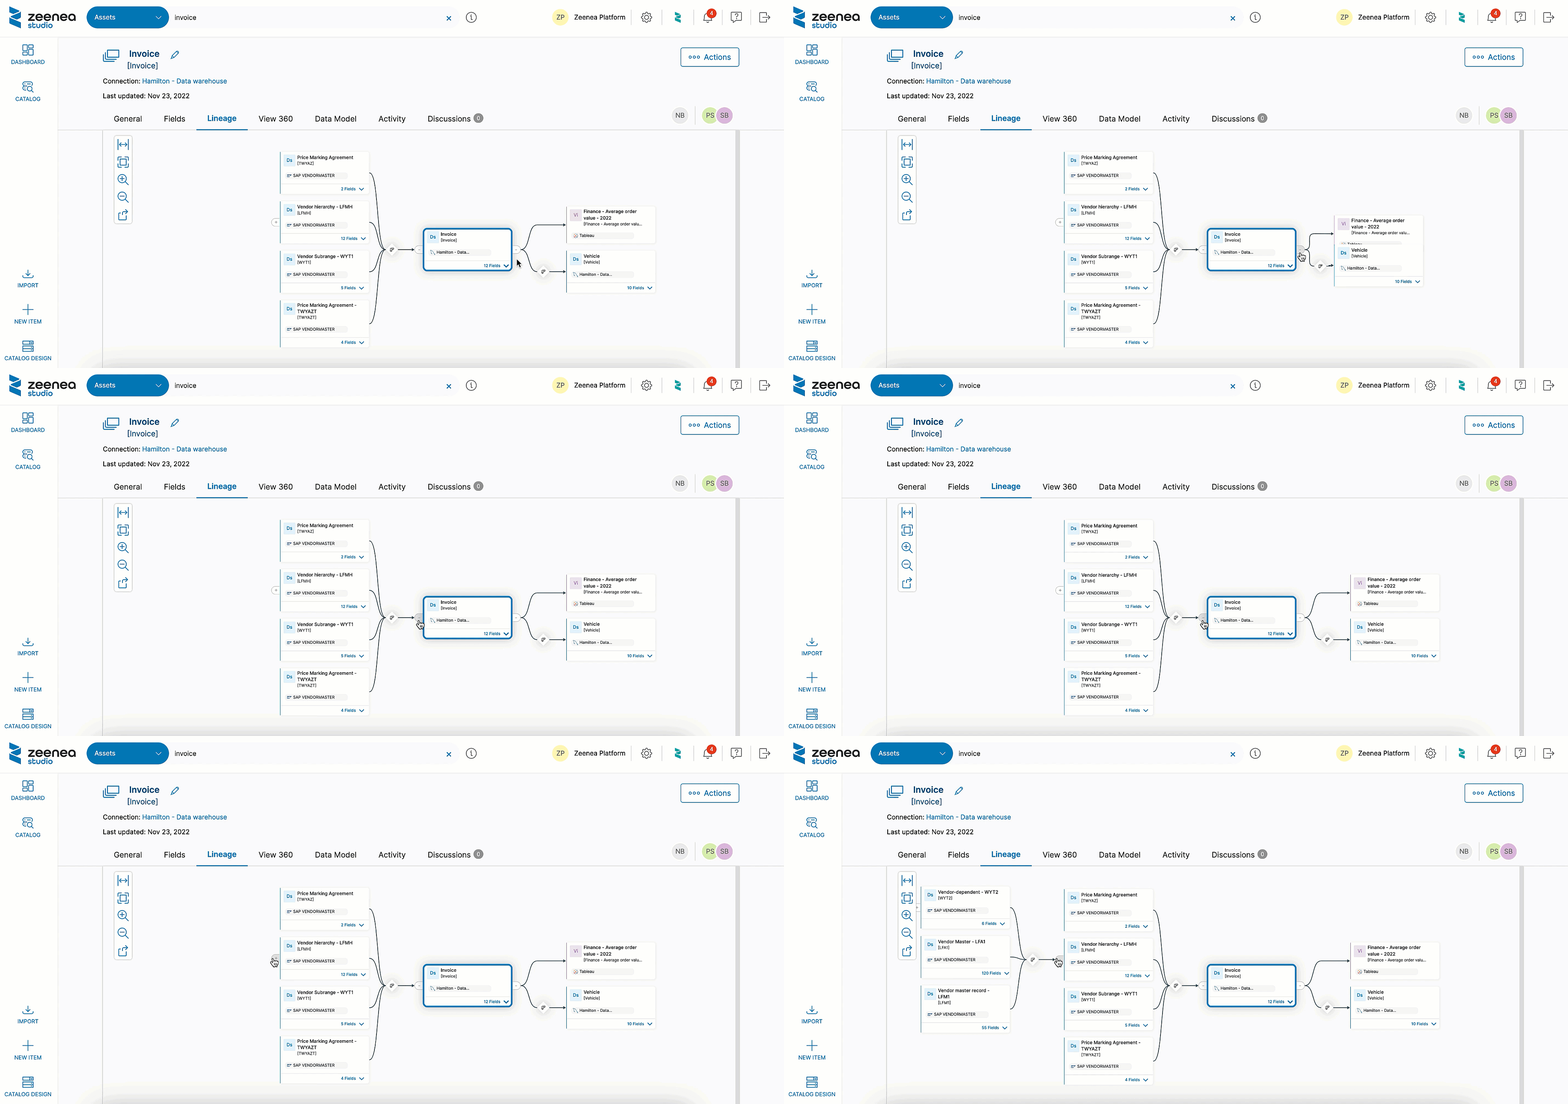
In the Lineage graph of your Datasets or Data Processes, simply click on the Fields dropdown button to unveil the transformation processes applied to each Field.The transformation process of your Fields is highlighted, and the other components are shaded. You can always expand your Field-level lineage by clicking on the “+” in the graph.
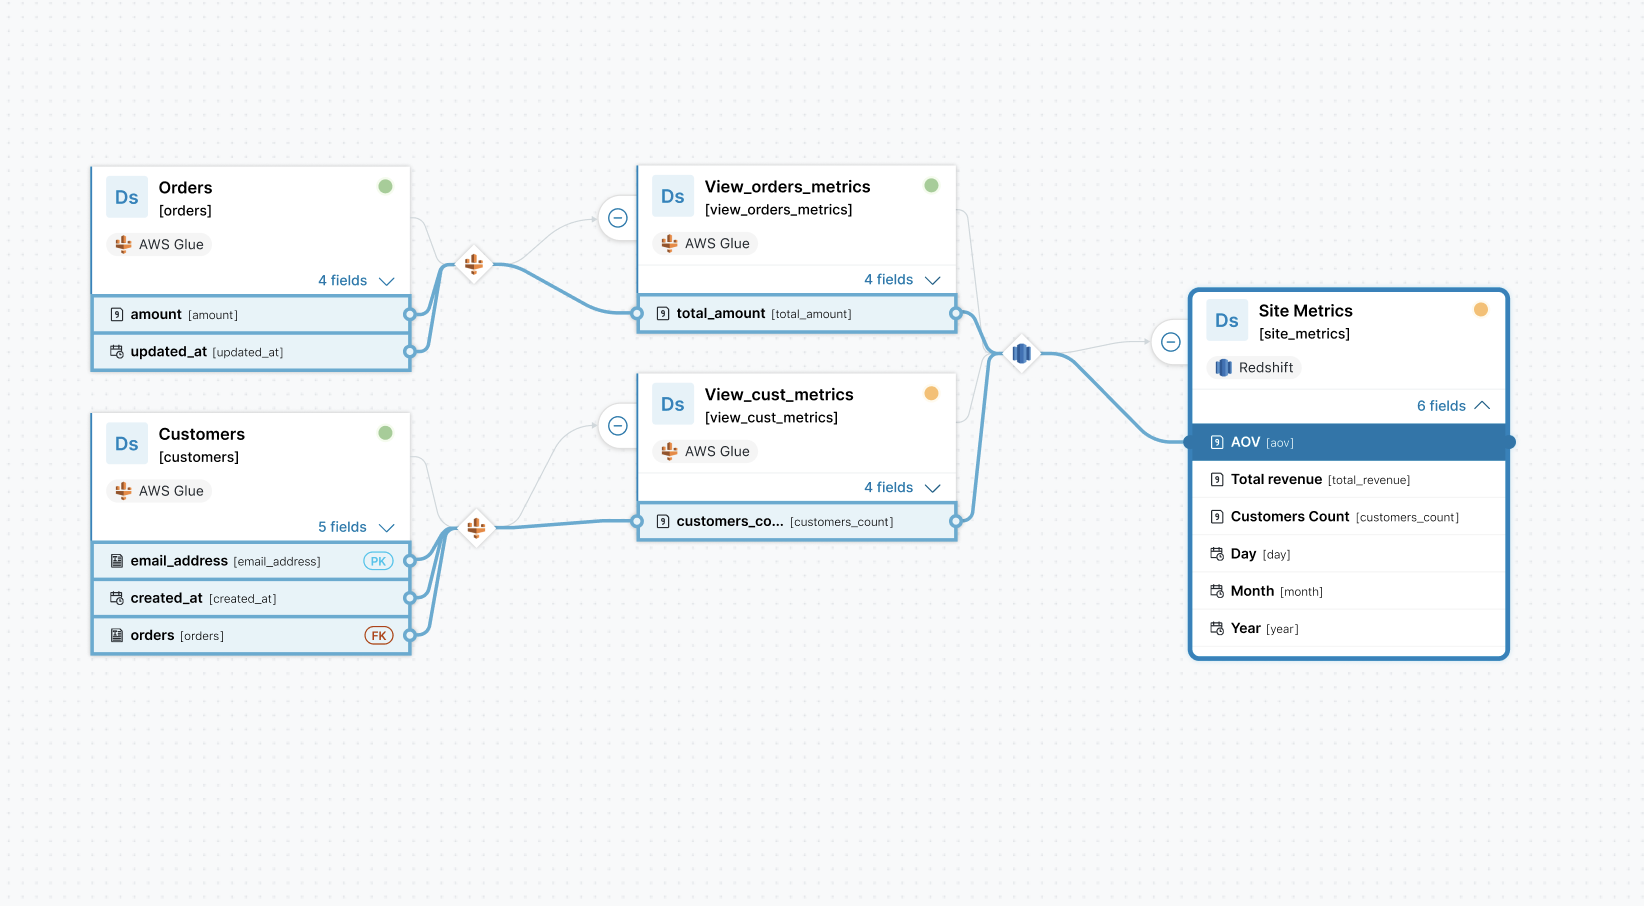

Zoom in and out of the graph, zoom to fit, reset to the default view, and use the panorama view to easily navigate in the graph. You can also export your graph in PNG format to share it with your data team members!
Try our Data Lineage for yourself
Try Zeenea’s Data Lineage graph and all of our other next-gen features by signing up for the Live Product Tour!


