Monitor & Ensure Data Catalog Success with Zeenea’s Analytics Dashboard
-
Feature Note
Choosing a data catalog solution is crucial when defining your data strategy and key objectives. But how can you assess the performance of your data catalog? How is it utilized, and what value does it bring to your end-users? And most importantly, how can you be certain that your data catalog is a reliable source for your organization?
For this reason, we’ve introduced a new feature in Zeenea Studio: The Analytics Dashboard. This dashboard offers insights into how your organization utilizes Zeenea and incorporates documentation KPIs to consistently ensure the completeness and accuracy of your enterprise data.
In this Feature Note, learn everything you need to know about our Analytics Dashboard and how it empowers Data Managers to enable a successful data catalog program!
View Documentation KPIs
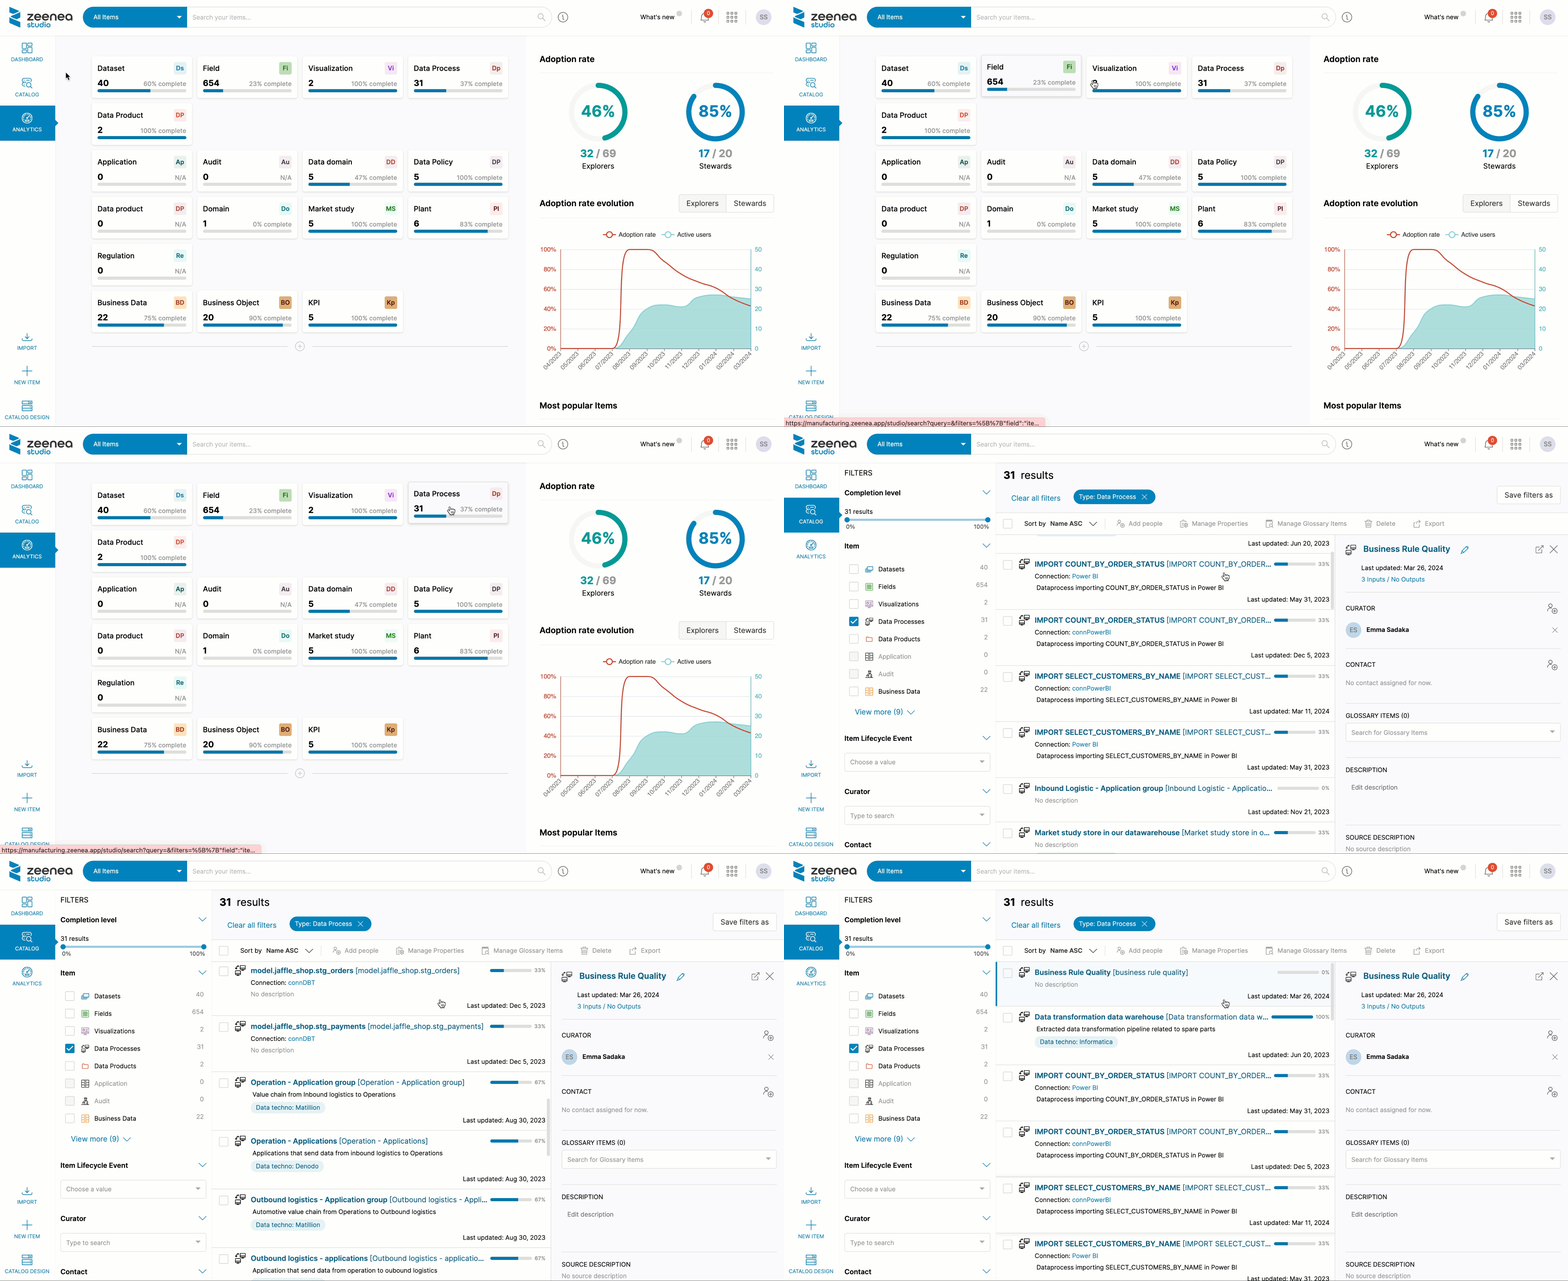
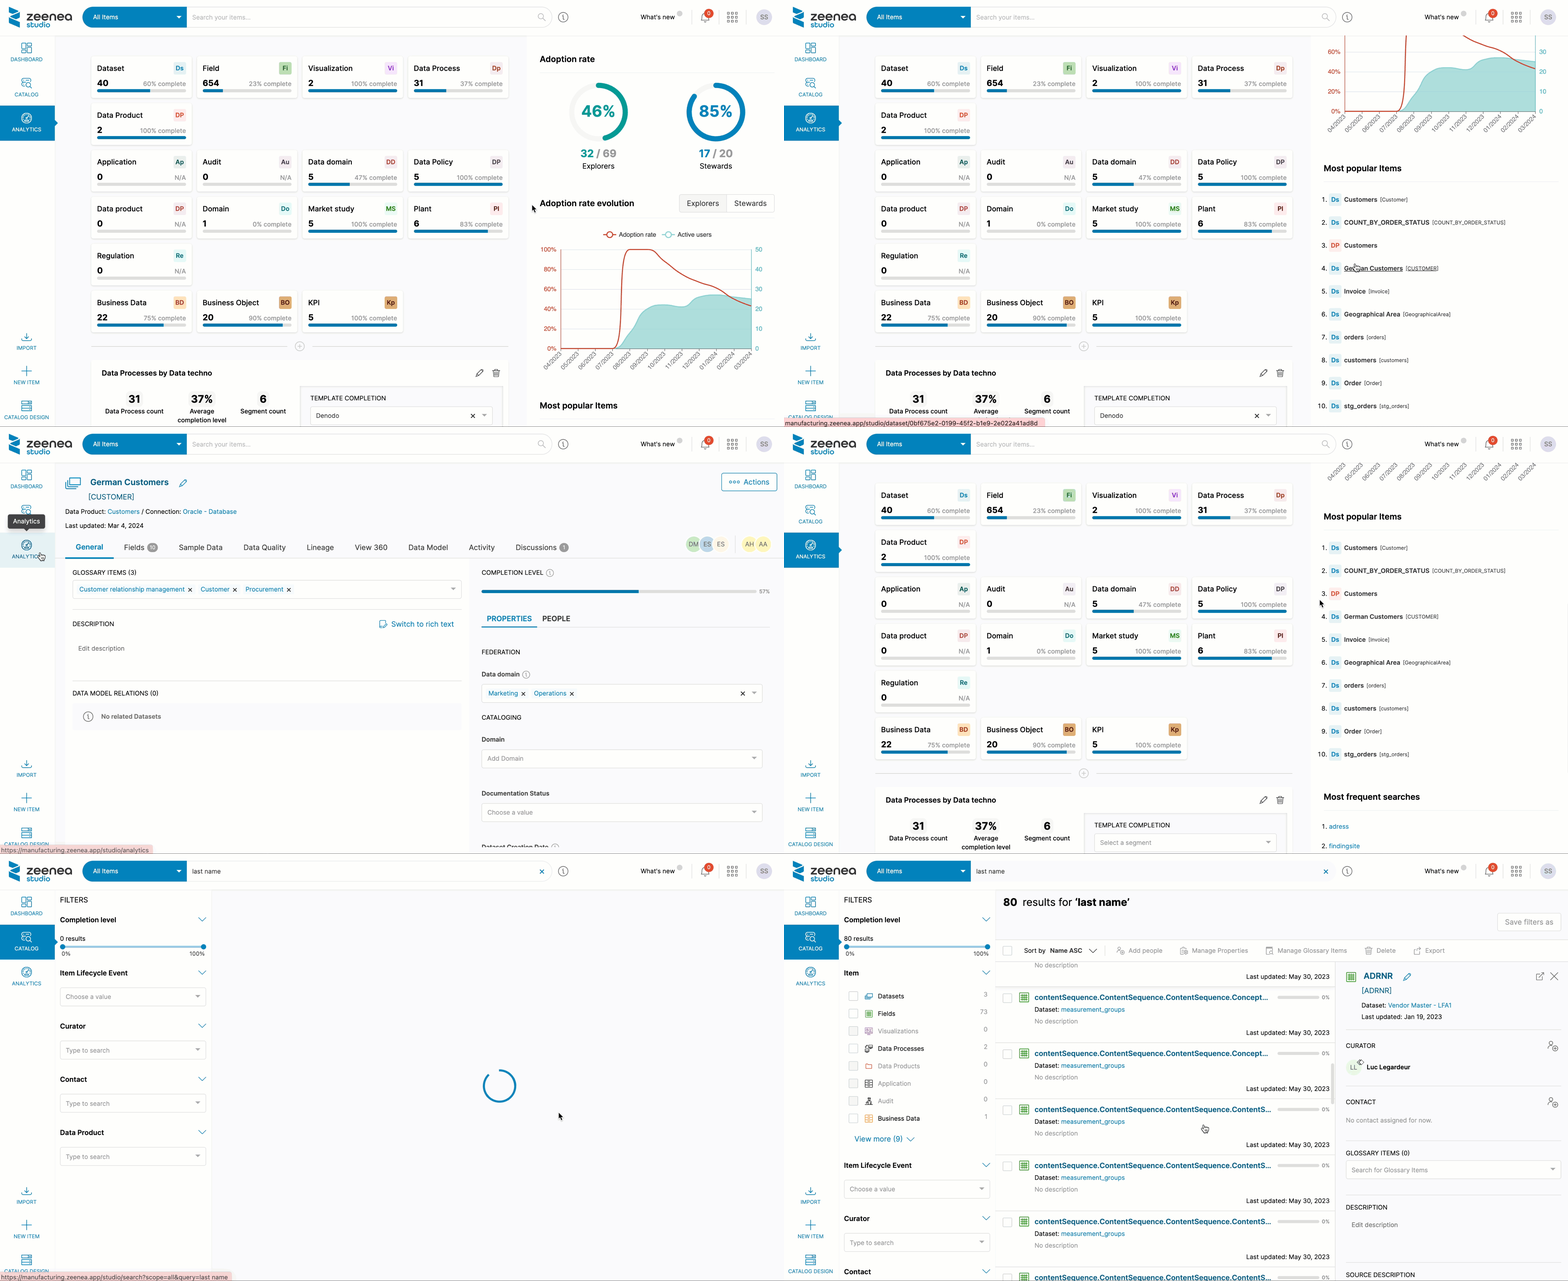
On the Analytics Dashboard page, you can directly view the completion level of all Item Types in your Catalog, including Custom Items. Each Item Type component provides essential details such as its name, Item count, completion percentage, and an easily recognizable icon associated with the Item Type.
Each component is clickable, enabling quick access to the Catalog section prefiltered by the selected Item Type.
Zeenea Studio – © 2024
Build Reports Based on Items’ Content
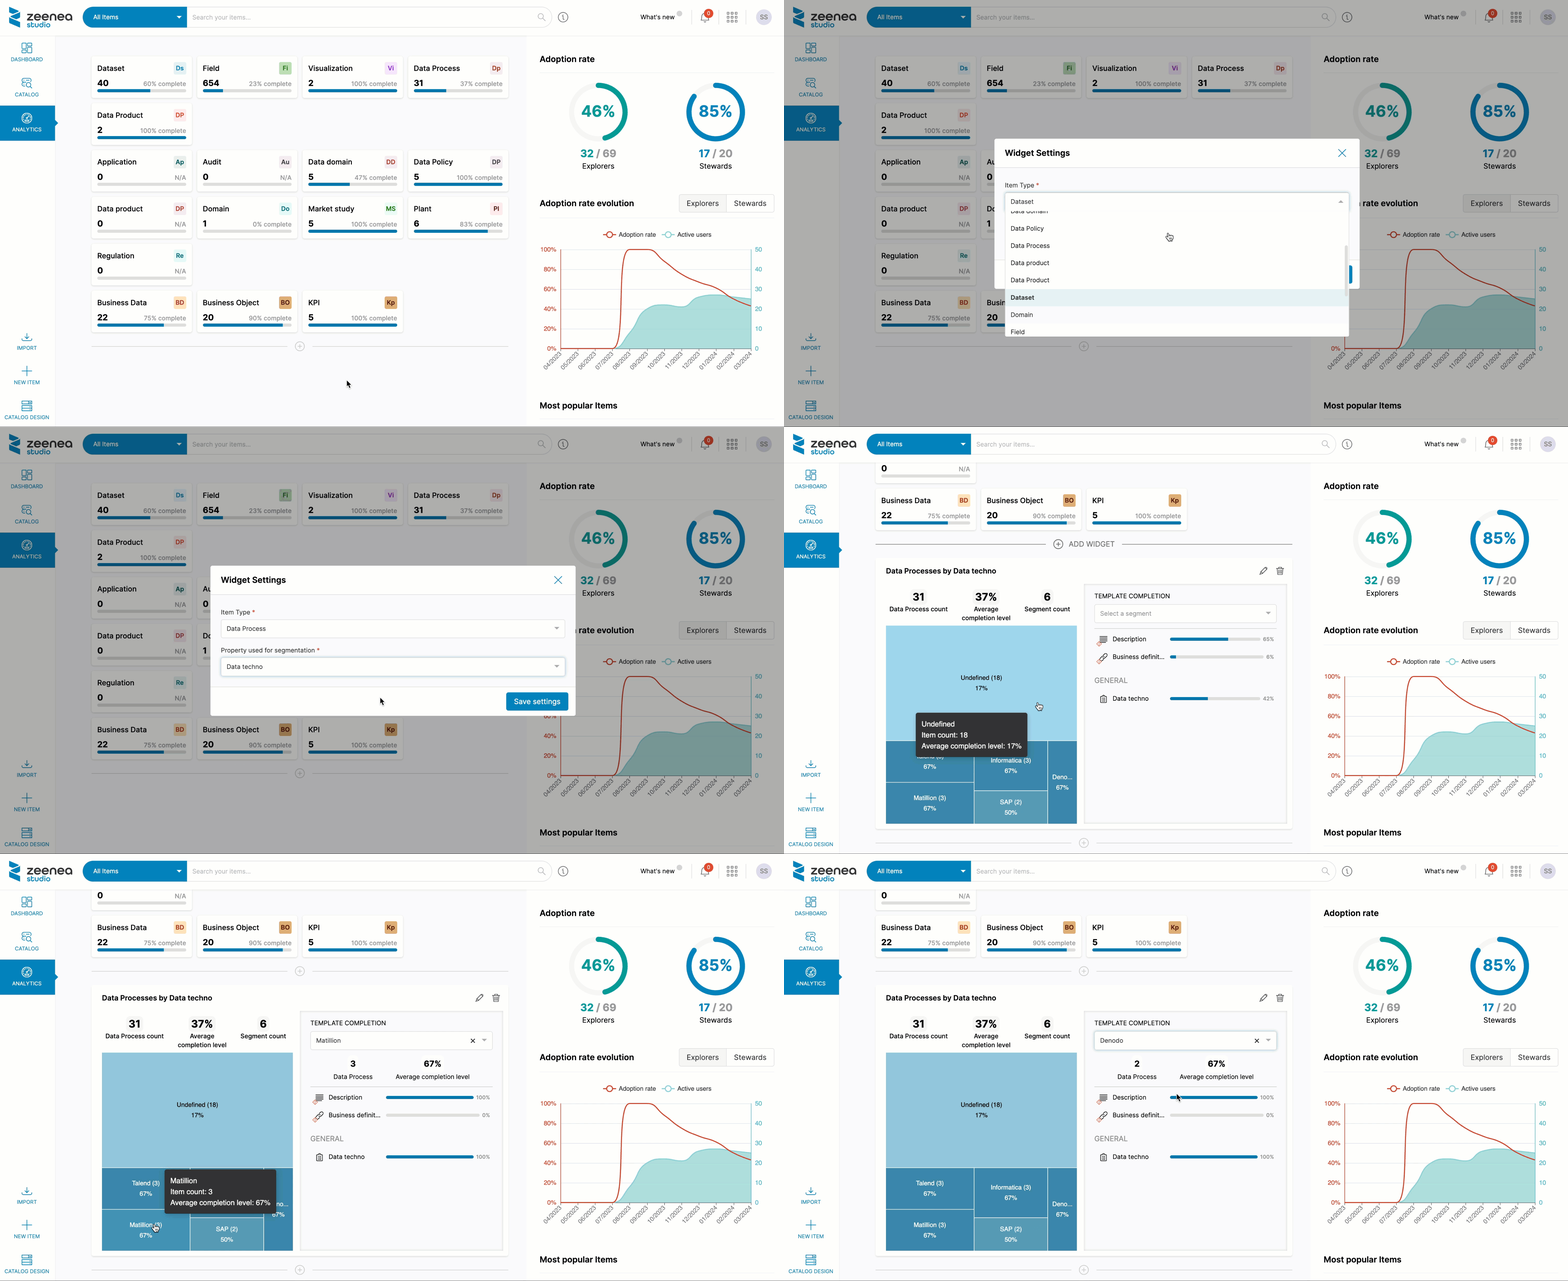
For more detailed information on the completion level of a specific Item Type, easily segment your Items based on Properties and generate insightful reports.
For example, you can segment your Datasets by Connection to get a comprehensive view of the number of Datasets associated with each connector and the average completion level of their documentation. Alternatively, segmenting Fields based on the presence of Personally Identifiable Information (PII) allows you to assess whether essential properties are adequately documented.
Once you’ve selected your Item Type and Property segment, the Analytics Dashboard generates a Widget. This Widget provides detailed information, including:
- On the right-hand side: Item count, Average completion level, Segment Count, and a graphical representation for a quick overview of the completion level of each Segment.
- On the left-hand side: The completion level of all properties, descriptions, and linked Glossary Items based on your Item Type’s template for each Segment.
This feature highlights average completion levels and assists data catalog Administrators in identifying areas that may require additional documentation to ensure catalog completeness and accuracy.
Zeenea Studio – © 2024
Measure Catalog Adoption
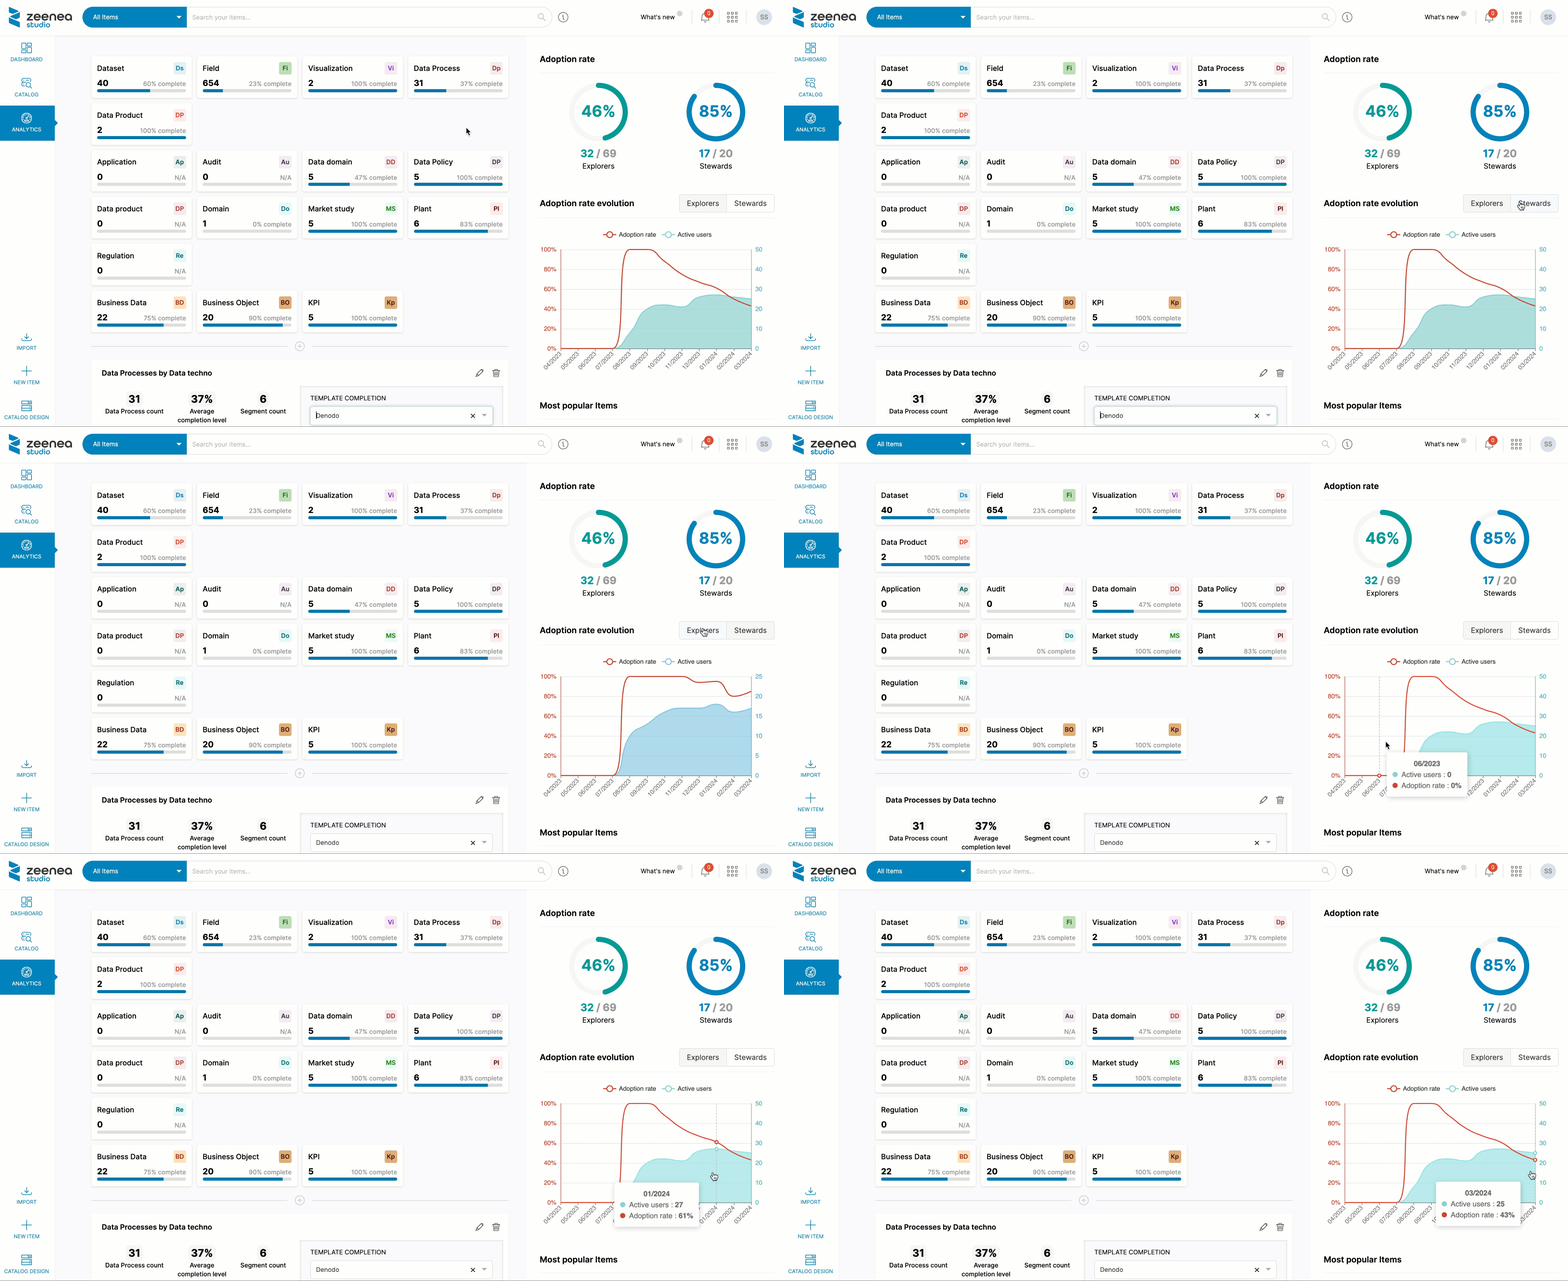
On the right-hand side of the Analytics Dashboard, find practical metrics regarding catalog adoption and Zeenea usage:
- Adoption Rate: Assess data catalog adoption by determining the number of activated accounts among the total Explorers and Stewards. This widget provides a quick snapshot of how widely Zeenea is used within your user community.
- Adoption Rate Evolution: Visualize the evolution of the adoption rate over time with an intuitive and user-friendly graph. Track the number of active users and their adoption rates by date and easily observe the adoption curve of your catalog.
Understanding these metrics is essential for gauging the value generated by your data catalog and assessing its adoption rate. It provides insights into the catalog’s usability, onboarding experience, and, ultimately, the efficiency with which users discover their data.
Zeenea Studio – © 2024
Understand how Zeenea is used by users
Gain insights into the most consulted, used, and sought-after Items in Zeenea:
- Frequently Consulted Items: View the top 10 most frequently used and consulted Items in the Catalog by all users. Each entry is clickable and enables you to explore the selected Item’s content.
- Most Frequent Searches: View the top 10 most searched Items in the Catalog. Each search term is clickable and opens a gateway to explore the results in the Catalog section to understand what users are actively seeking.
These metrics not only measure popularity but also provide insights into the core impact of your data catalog. They help ensure alignment with the Items that hold the most significance for your user community.
Zeenea Studio – © 2024
