

HCLSoftware Completes Acquisition of Metadata Management Software Provider Zeenea
Acquisition will enable Actian, a division of HCLSoftware, to offer customers a complete data ecosystem.
SANTA CLARA, Calif., September 12, 2024 – HCLSoftware, the software business division of HCLTech, today announced that it completed the acquisition of Zeenea, an innovator in data catalog and governance solutions based in Paris, France. The acquisition of Zeenea enables Actian, a division of HCLSoftware, to offer a unified data intelligence and governance solution that empowers customers to seamlessly discover, govern, and maximize the value of their data assets. It also further extends Actian’s presence, workforce, and customer base in Europe.
“To become data-driven, organizations of all sizes need data governance to ensure the most effective and efficient use of quality data throughout its life cycle,” said Marc Potter, CEO at Actian. “With Zeenea as part of our portfolio, Actian offers customers a complete data ecosystem – making Actian a one-stop shop for all things data. Together, we will help our customers propel their GenAI and analytics initiatives forward by boosting confidence in data preparation and enhancing data readiness.”
According to ISG Research, 85% of enterprises believe that investment in generative AI technology in the next 24 months is critical. Data governance and data quality work in tandem to ensure the data feeding the GenAI solutions is accurate, complete, fit-for-purpose, and used according to governance policies.
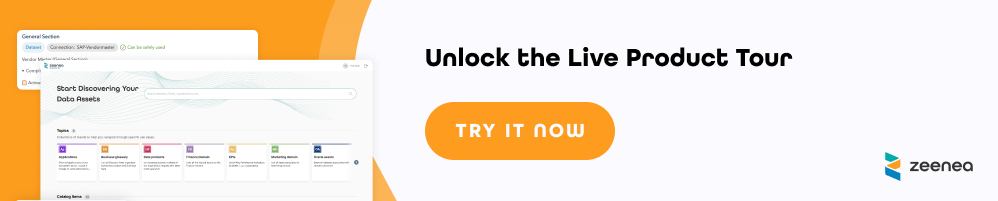
Zeenea is recognized for its cloud-native Data Discovery Platform with universal connectivity that supports metadata management applications from search and exploration to data catalog, lineage, governance, compliance and enterprise data marketplace. Powered by an adaptive knowledge graph, Zeenea enables organizations to democratize data access and generate a 360-degree view of their assets, including the relationships between them.
About Actian
Actian makes data easy. We deliver a complete data solution that simplifies how people connect, manage, govern and analyze data. We transform business by enabling customers to make confident, intelligent, data-driven decisions that accelerate their organization’s growth. Our data platform integrates seamlessly, performs reliably, and delivers industry-leading speeds at an affordable cost. Actian is a division of HCLSoftware.
About HCLSoftware
HCLSoftware is the software business division of HCLTech, serving more than 7,000 organizations in 130 countries in five key areas: Data and Analytics; Business and Industry Applications (including Commerce, MarTech Automation); Intelligent Operations; Total Experience; and Cybersecurity.
https://www.hcl-software.com/
For further details, please contact:
Danielle Lee, ActianDanielle.Lee@actian.com
Jeremy McNeive, HCLSoftware jeremy.mcneive@hcl.com